
Your Smarter, Scientific
Wealth Creation Engine
AI & Data driven, Quant-based Investment Advisory -
SEBI Registered
Why Native Invest?
Investor-first
No "get you rich overnight" F&O strategies or "hot stock tips", but focused long-term investing for wealth creation.
Expert Curated
Team of CA/CFAs + Computer Engineers design the right investment strategy for you!
AI & Data Driven
Data and AI tools drive our quant-based models – thoroughly rule based, no space for human emotions & biases!
Low Cost
Portfolio of Low cost ETFs + modest advisory fees without backhanded commisions. All in all: Higher Returns in Your Hands!
Ease of Execution
Investing in SMART portfolios takes only 5 minutes online and done via your stock broker (18+ brokers integrated) – no hassle, full control!
Choice of Investing Journeys
Quant-based portfolio of ETFs – check. Define & track goals – check. DIY explore & compare ETFs/ Index Funds – check.
Choose Your Journey
Pick the path that fits your investing style — from hands-off expert management to full DIY analytics.
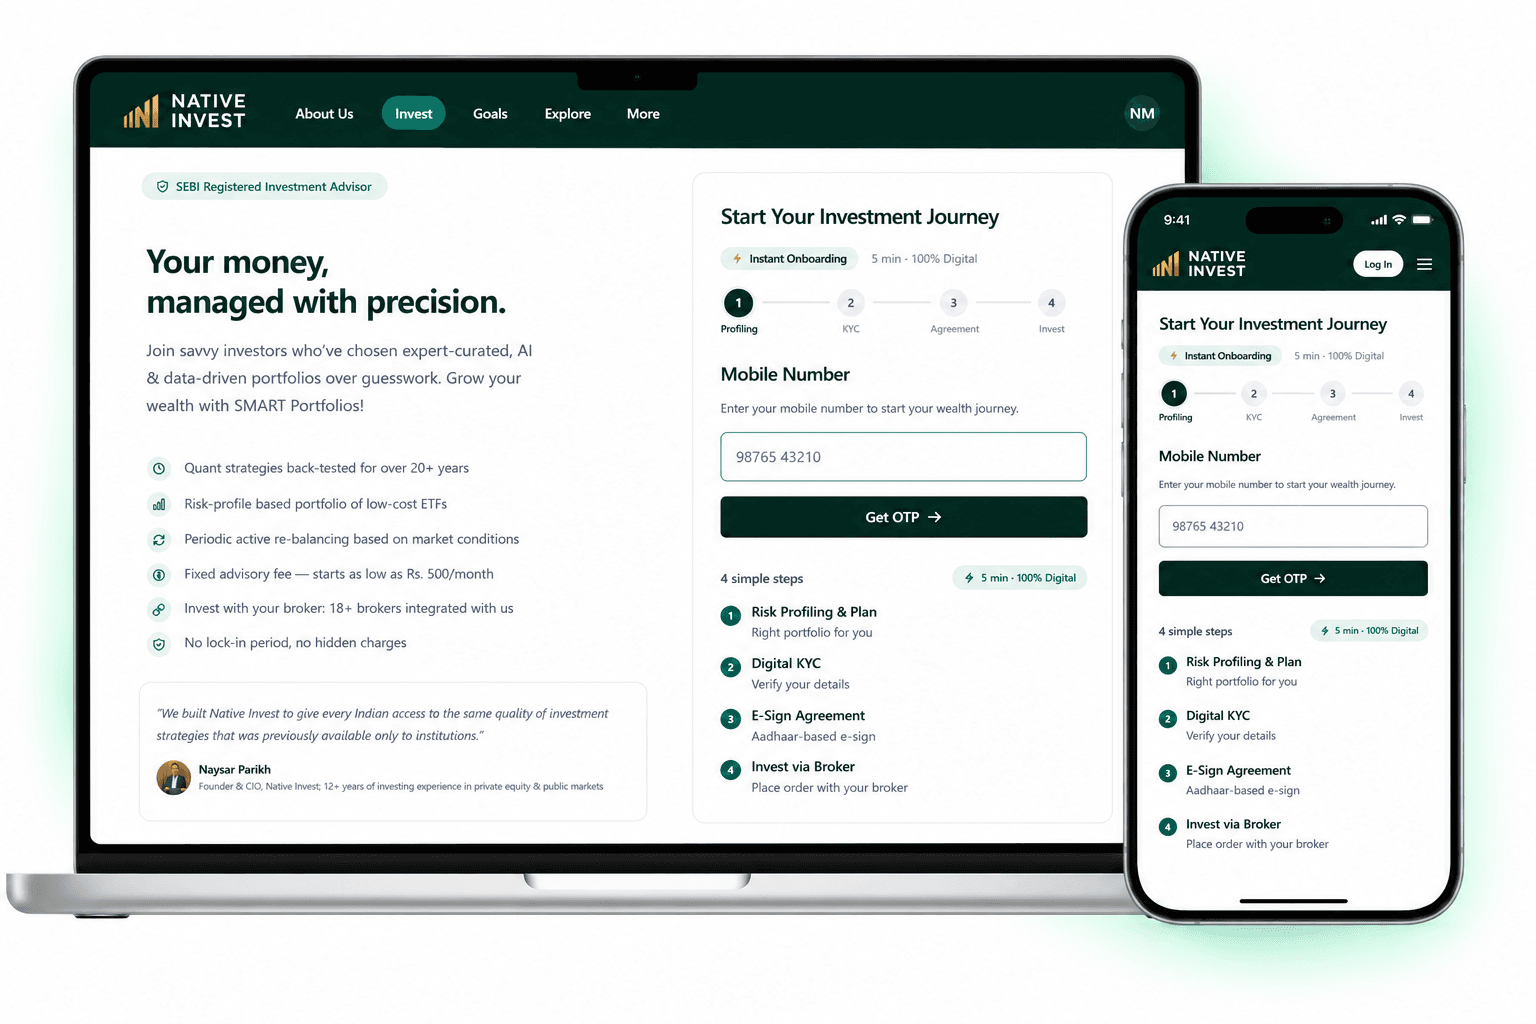
SMART Portfolios
- Quant-based Portfolio of low cost ETFs aimed at wealth creation
- Multi-Asset Portfolios designed to your risk profile
- Min Investment Amount only ₹10 lacs. Fees starting as low as 0.5% p.a.
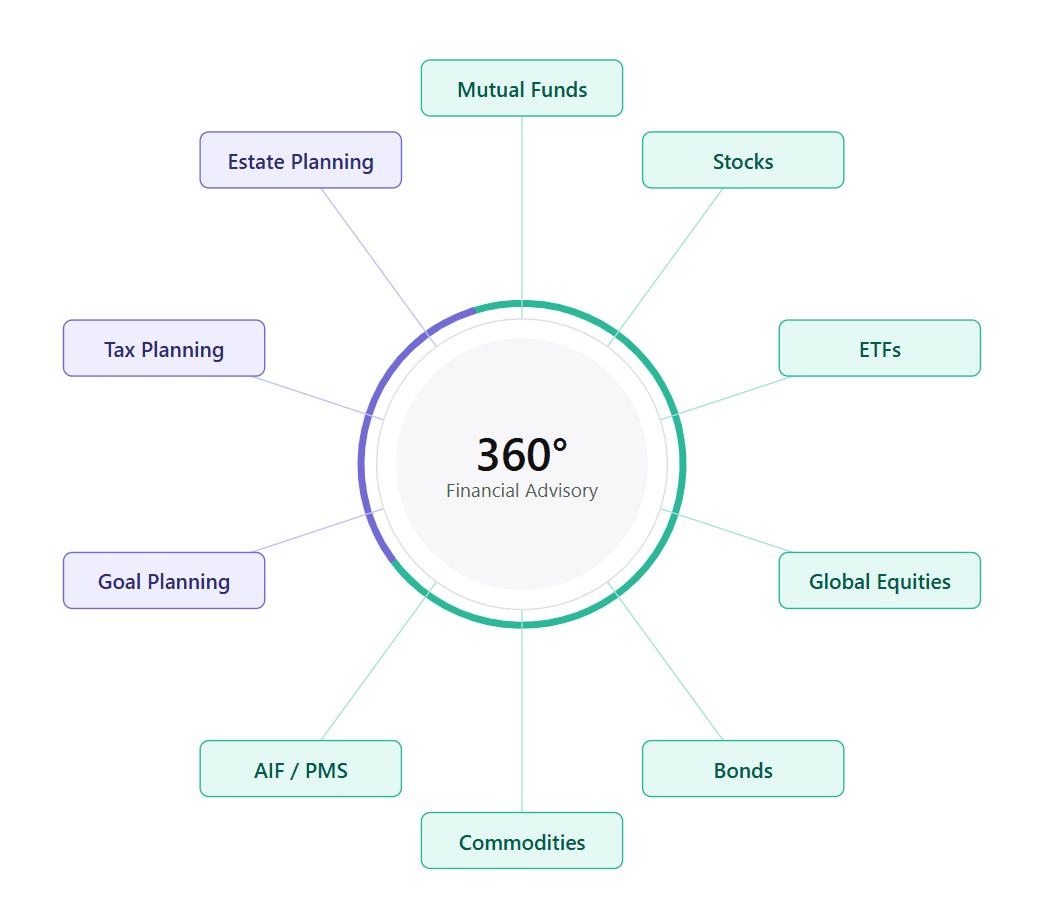
Spectrum 360
- Data & AI-driven Wealth advisory for your Family
- Thorough Financial Review, Asset Allocation, Tax Planning, Goal Mapping, Estate Planning
- Minimum Asset Size: ₹1 crore
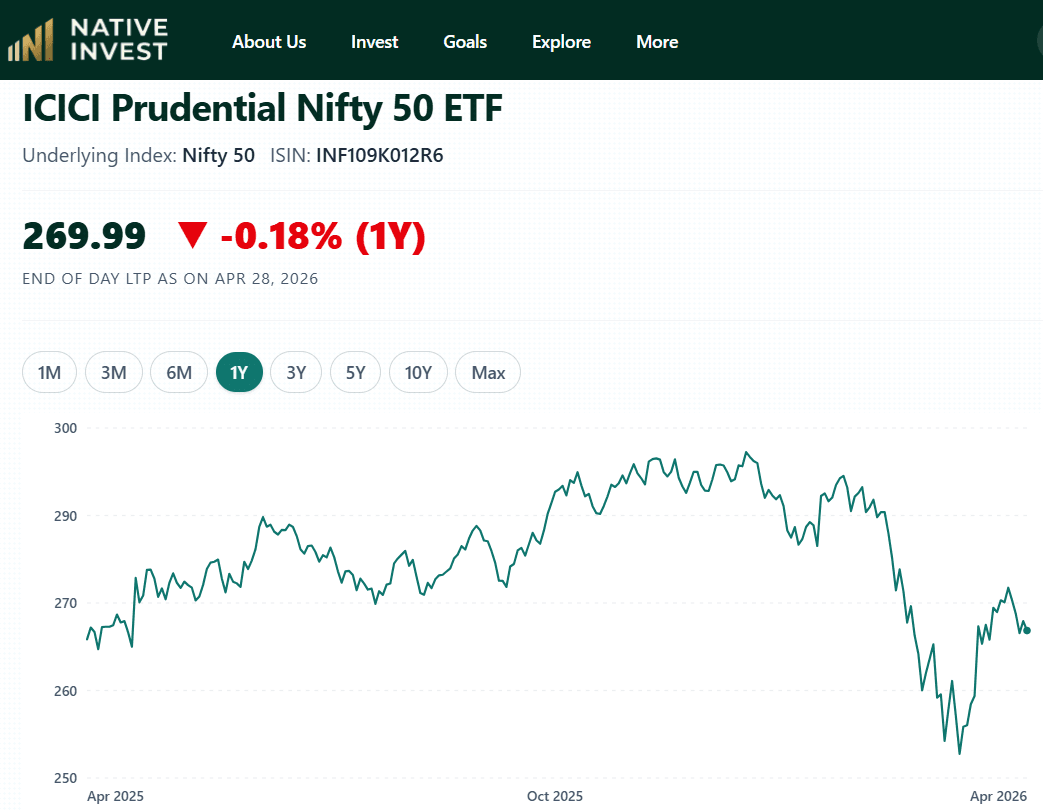
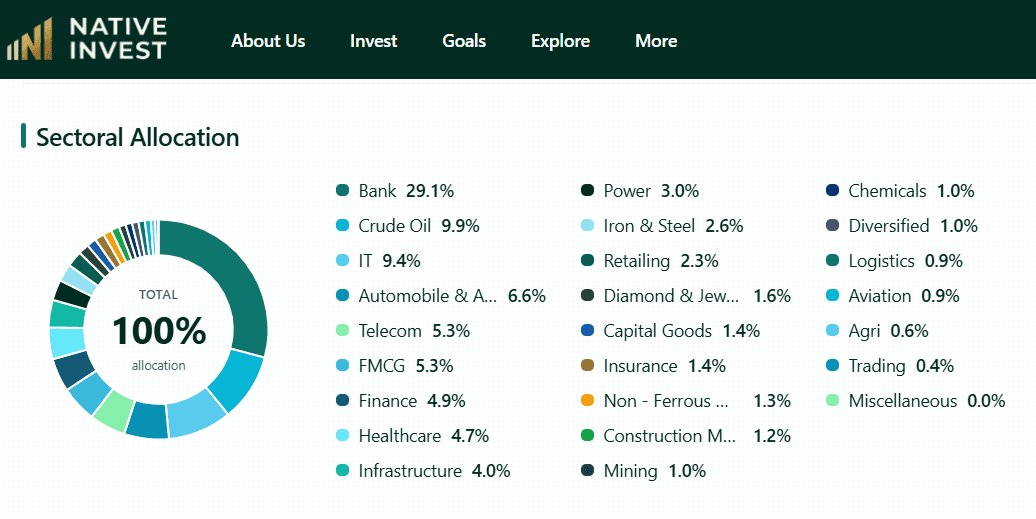
Index Explorer
- 100% focus only on Index Funds and ETFs — unlike other portals who focus on active funds, and give index funds in some corner
- Compare similar Funds, run specific screeners, focus on ratios like Tracking Error, Expense Ratio, etc.
- Only Direct Plans. No fees / charges
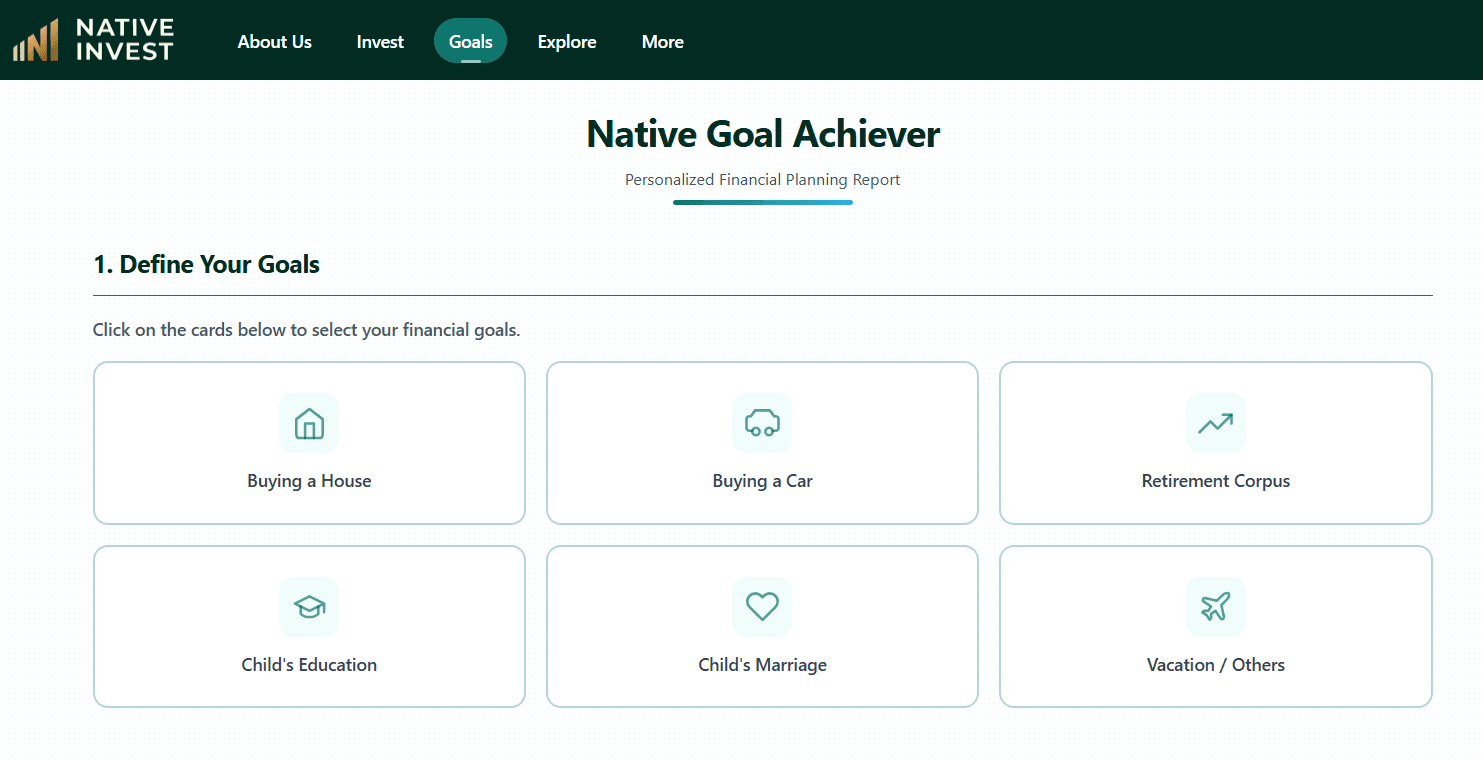
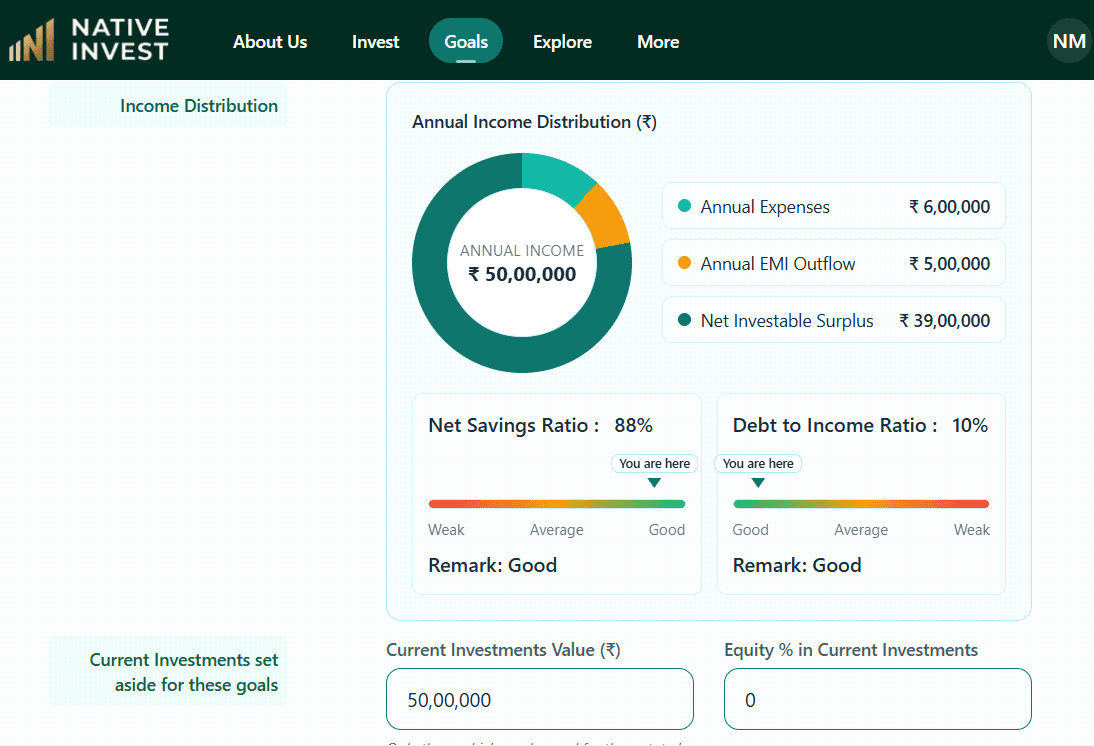
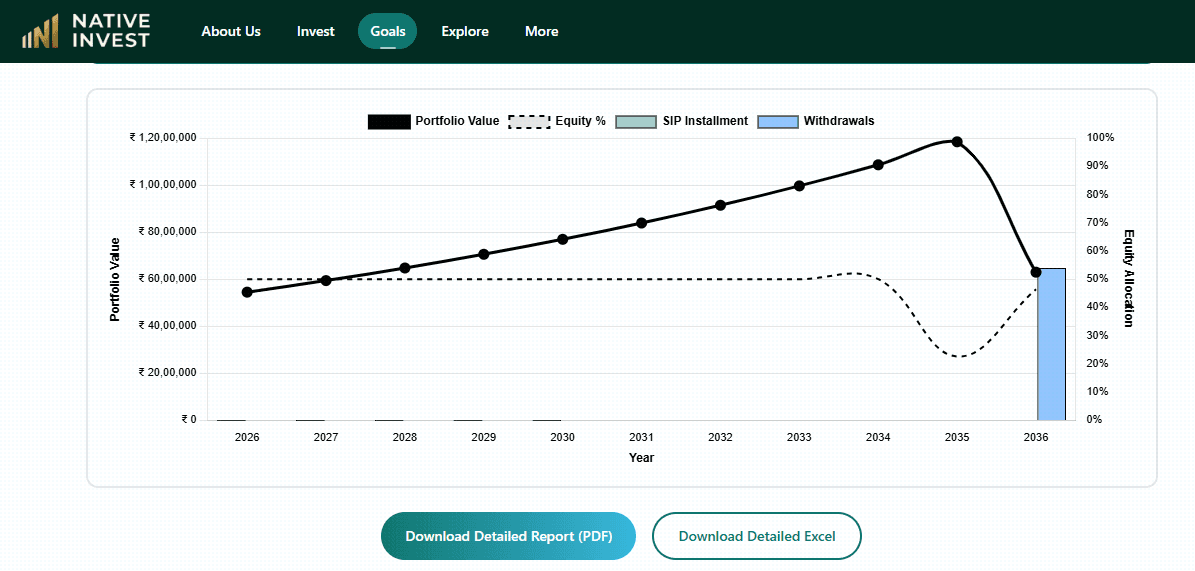
Milestone Map
- Plan your financial goals in a data-backed manner — free of cost, online
- Compute how much money you need for retirement and how you should invest to get there
- Take benefit of our Glide Path Allocation which moves between Equity, Multi-Asset & Debt based on your target goals
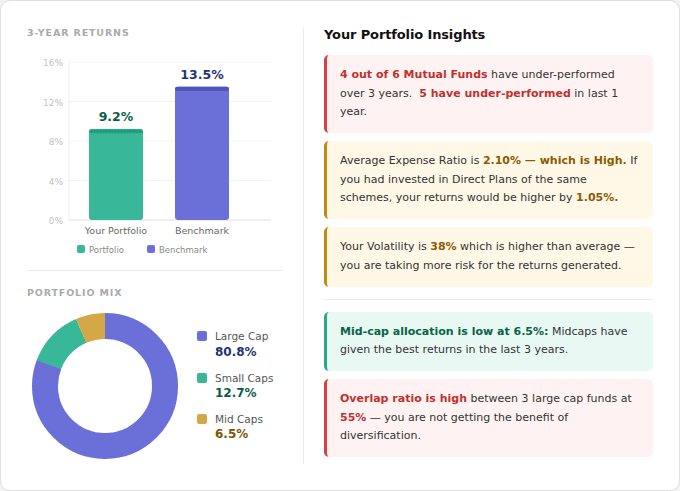
Wealth Diagnostic
- Review your portfolio to check if you actually beat the benchmark returns
- Schedule a 1-1 call with our experts to understand areas of under-performance and how it can be improved
- Coming Soon — stay tuned.
Meet Our Founder & CIO

"An ardent public market investor since 2014, on a mission to bring institutional-grade investing to every Indian."
Career Highlights
- Vice President at The Carlyle Group — US Listed, Global Top 4 Private Equity firm with $400B+ AUM. Led investment process & portfolio management across Financial Services, Technology, Healthcare & Consumer sectors.
- Management Consultant at Boston Consulting Group (BCG) — Global Top 3 strategy firm. Led Strategy & Ops Transformation in industrial and Consumer sectors.
Credentials
All-India Rank Holding Chartered Accountant (CA) · Graduate in Commerce · SEBI Registered Investment Adviser
Create wealth with SMART Portfolios — Start Investing Now
Expert-curated, AI & data-driven quant strategies.
No guesswork, no biases — just smarter, scientific investing.
Begin your journey
Fixed fee · No hidden charges · 18+ brokers
The Science Behind It
Artificial Intelligence + Human Wisdom
+ Data Science = Native SMART Portfolios
What we have
Done
1 Billion+
data points analyzed using AI
Rules-based systematic strategy
built from decades of market data
21 years
back-tested & stress tested
What we do
Now
Analyse your risk profile
personalised to your goals
0.5M+
new data points processed daily
Allocate right low-cost ETFs
matched precisely to your profile
What we will do
Going
Forward
Actively track your portfolio
continuous monitoring, zero guesswork
Auto re-balance when markets shift
rules-based, no emotional decisions
Regular market & portfolio updates
sent directly to you
Simple, Smart, Scientific Investing — for your wealth creation
Product
Our Flagship Native SMART Portfolios
Each Portfolio consists of ETFs (Exchange Traded Funds) and follows a unique strategy — based on your Risk Profiling, we will recommend the product which best suits your profile & risk appetite.
Note: The ring chart represents the maximum equity allocation for each portfolio. Unfilled segments indicate non-equity allocation.
SMART Catalyst
Asset Class: Indian Equities with occasional to Liquid Fund & Gold Strategy Type: Aggressive Equity Exposure: Up to 100% across Small, Mid & Largecap
SMART Omni Surge
Asset Class: Indian Equities, Debt, Gold/Silver Strategy Type: Balanced Equity Exposure: Up to 80% across Small, Mid & Largecap
SMART Omni Shield
Asset Class: Indian Equities, Debt, Gold/Silver Strategy Type: Conservative Equity Exposure: Up to 60% across only Mid & Largecap
SMART Omni Yield
Asset Class: Debt/ Fixed Income Strategy Type: Capital Protection Equity Exposure: Nil
Pricing
Transparent & Reasonable Pricing
Our fees are charged as a percentage of your average portfolio value and billed monthly.
| Average Portfolio Value | Annual Fee (Billed Monthly) |
|---|---|
| Up to ₹25 Lakhs | 0.60% p.a. |
| Above ₹25 Lakhs | 0.50% p.a. |
Subject to a minimum billing of ₹500 per month.
- ✓No back-handed commissions from anyone (like Distributors, Bankers, etc. receive from AMCs/ Brokers)
- ✓No Upfront fees. No hidden charges. No share in profit.
How it Works?
If your average portfolio value for May 2026 is ₹30,00,000, your fee is calculated as: (₹30,00,000 × 0.5%) ÷ 12 = ₹1,250 p.m.
How it's Billed?
Billed on a post-paid basis and auto-debited via the SMART Auto-Pay mandate you register during onboarding.
What is my total cost including ETF expenses?
Weighted Average Expense Ratio of your Portfolio ETFs is 0.2 – 0.3% p.a. — this is part of NAV, not charged to you separately. So including our advisory fees at 0.5 – 0.6% p.a., total cost to you would be roughly 0.7 – 0.9% p.a.
How our fees compare to others?
Total all-in cost (advisory + ETF expense ratios) as a % of assets per annum.
What It Means
What Are SMART portfolios?
Investing Questions, Answered Simply
Plain-language answers to what people actually ask about quant investing, ETFs, index funds, and market risk.
What is quant-based investing?
What is the difference between an ETF and an index fund?
Are ETFs or index funds better than actively managed mutual funds for long-term wealth creation?
What does a SEBI Registered Investment Advisor (RIA) do, and how is that different from a distributor?
How often should an investment portfolio be rebalanced?
What happens to a portfolio when markets crash?
What is an expense ratio, and why does it matter?
Is passive (index) investing really better than active investing?
More questions? See the full Support & FAQ section or our SEBI disclosures.