Insights
Does a Quant-based Portfolio work?
We create a quant & rule-based US passive portfolio and back-test it over last 100 years
In this article
- Background
- Time in the Market vs Timing the Market
- Asset Allocation
- Construction of the Portfolio
- Portfolio Performance
- Key Inferences
- Conclusion
Background
This is a continuation of our previous blog titled "What a century of capital market data teaches us!" (click the link to read it).
Here, we incorporate some of the learnings from past 100 years of US market data into portfolio construction. We create a portfolio which is quant-based without any manual intervention - allocation happens based on the pre-defined rules.
However, just to be fair, we will put a Disclaimer at the very beginning. This blog needs to be read and understood with the following points in mind:
We have had the benefit of hindsight
We have obviously analyzed what works and then created portfolios - overfitting also cannot be ignored.
What happened in the past or what happened in US, not necessarily will happen in India (or even US for that matter) in the future. Future remains uncertain!
But our purpose is to demonstrate a quant & rule-based portfolio, the framework & parameters that can be followed and check if they work and to what extent. And also, we have been very stringent with the rules - in the sense that we actually use only historical data as of that date to allocate and we let the model auto-allocate based on the set rules.
The study is based on 3 principles:
Actively Passive : Using passives to generate alpha - there is no stock selection, we invest in the index. (Read our previous blog titled “The Growth of Passives”)
Asset Allocation : we invest across equities, debt & gold
Quant-based : Use of macros & factors across different parameters, no manual intervention but auto-allocation
Time in the Market vs Timing the Market
We do not necessarily agree with the: “Time in the market” > “Timing the market” ideology.
If we look at Buffet, he has invested huge chunks during market corrections and done nothing for years when markets were in exuberance - he is currently also sitting on a ~$380 billion historic cash pile. This is timing the market!
Similarly, if we look at Pulak Prasad’s Nalanda Capital, one of the most successful India focused FIIs, we will notice a similar trend. In his book, “What I learned about investing from Darwin” (PS: this is a great read), Pulak explains how majority of their investments have been made in three time periods of bear markets: 2008-09, 2011 and 2020. Then, they have just stayed invested, rarely selling or has he puts it, been “very lazy”!
Hence, we believe the key to investing success in equities is to know when to buy and when to wait - one does not need to be in the markets buying all the time. Knowing when to be in the markets and when out of it, is the driver of alpha!
So we prefer : “Timing the Market” followed by “Time in the Market”!
Asset Allocation
As we wrote in our previous blog on 100 years of US markets, Asset Allocation is critical to ensure we get the best of all asset classes.
Also, if we follow “Timing the Market” as above and if we are not buying equities, we will by default be required to diversify to other asset classes.
Several researchers have also ferociously advocated asset allocation. A study paper by Brinson, Hood, and Beebower in 1986 suggests that on an average ~94% of the Funds portfolio returns are driven by investment policy i.e. which asset classes to include & exclude and weights across those asset classes.
Construction of the Portfolio
We are not quant specialists, so our attempt is to use first principles to understand and test different parameters and factors which could affect portfolio returns. Based on the points above , we believe for any quant portfolio, one needs to first establish on what parameter should we be “Timing the market”.
We use 3 parameters of Macro, Valuations and Momentum (“MVM”) to categorize all months into ‘Good Markets’ or ‘Bad Markets’ and in-turn determine if we will be in the equity markets or out of it.
Let’s get into each of these 3 factors, which we check for at start of each month, based on previous months data:
Macro - here we consider inflation, given our study showed that it is one of the most relevant macro factor for US markets. Equity markets have generally struggled during periods of high inflation. Hence, we categorize periods of high inflation i.e. annual inflation >3% as ‘Bad Markets’.
Valuations - instead of just looking at P/E, we use BEER (Bonds to Equity Earnings yield Ratio).
BEER = Bonds Yield / Earnings Yield ; and given Earnings Yield = 1 / PE so
BEER = US 10Yr GSec Yield * S&P500 PE
What this does is that it takes P/E into context of the prevailing interest rates : If interest rates (cost of capital) are close to zero, say 0.5% and P/E is 20, then BEER is 0.1. However, if interest rates increase to 5% and P/E remains at 20, then the
BEER is 1. So, at the same P/E of 20, BEER changes drastically and rightly so, since in the latter case equities have become relatively over-valued when compared to bonds.
Generally, BEER close to 1 or above represents over-valuation for US → in our model we take BEER > 1.2 as over-valued markets and hence ‘Bad Markets’.
(PS: For India, a BEER above 1.5-1.6 would represent over-valuation.)
Momentum - For this we look at historical 6 month price movements and if it is in negative direction, we categorize it as ‘Bad Markets’
We have taken a risk-first approach and eliminated the Bad Markets. Everything else, is ‘Good Markets’.
Good Markets are risk-on where we allocate to Equities. Bad Markets are risk-off, and following our asset allocation principle, we move to safer assets like Debt and Gold.
Now, within Bad Markets, we look for instances when Gold has higher chances of out-performance for which we use the S&P/ Gold Ratio. In cases where the S&P/ Gold ratio is high i.e. because S&P has run up too much relative to Gold or Gold has fallen too much, we allocate more to Gold.
Therefore, the Native Invest Portfolio allocation is as follows:
→ In Good Markets - 100% Equities : S&P500 Index
→ In Bad Markets -
When S&P/ Gold Ratio >= 2 : 70% Gold and 30% US GSec
When S&P/ Gold Ratio < 2 : 50% Gold and 50% US GSec
Portfolio Performance
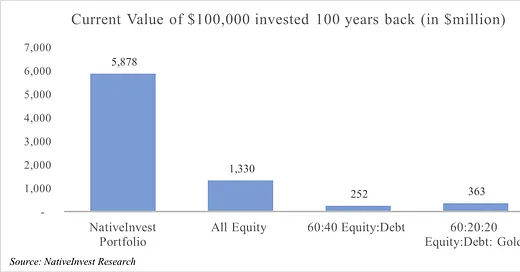
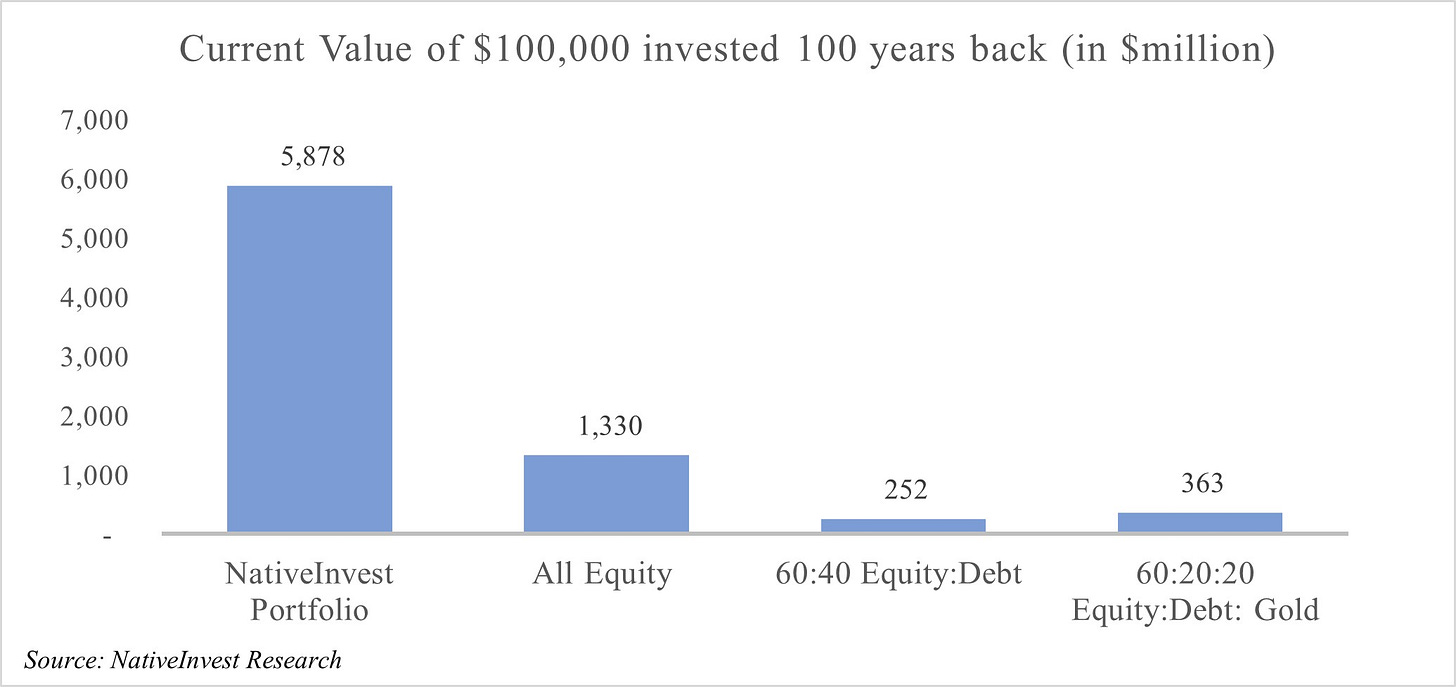
We compare our Model portfolio (Native Invest Portfolio) to 3 other Portfolios:
100% Equities (S&P500 Index)
60% Equities, 40% Bonds (the classic balanced portfolio)
60% Equities, 20% Bonds, 20% Gold (the newer version by Morgan Stanley recently)
Though, ours is a “Balanced” portfolio and is not directly comparable to Equities but rather to the other 2 balanced portfolios.
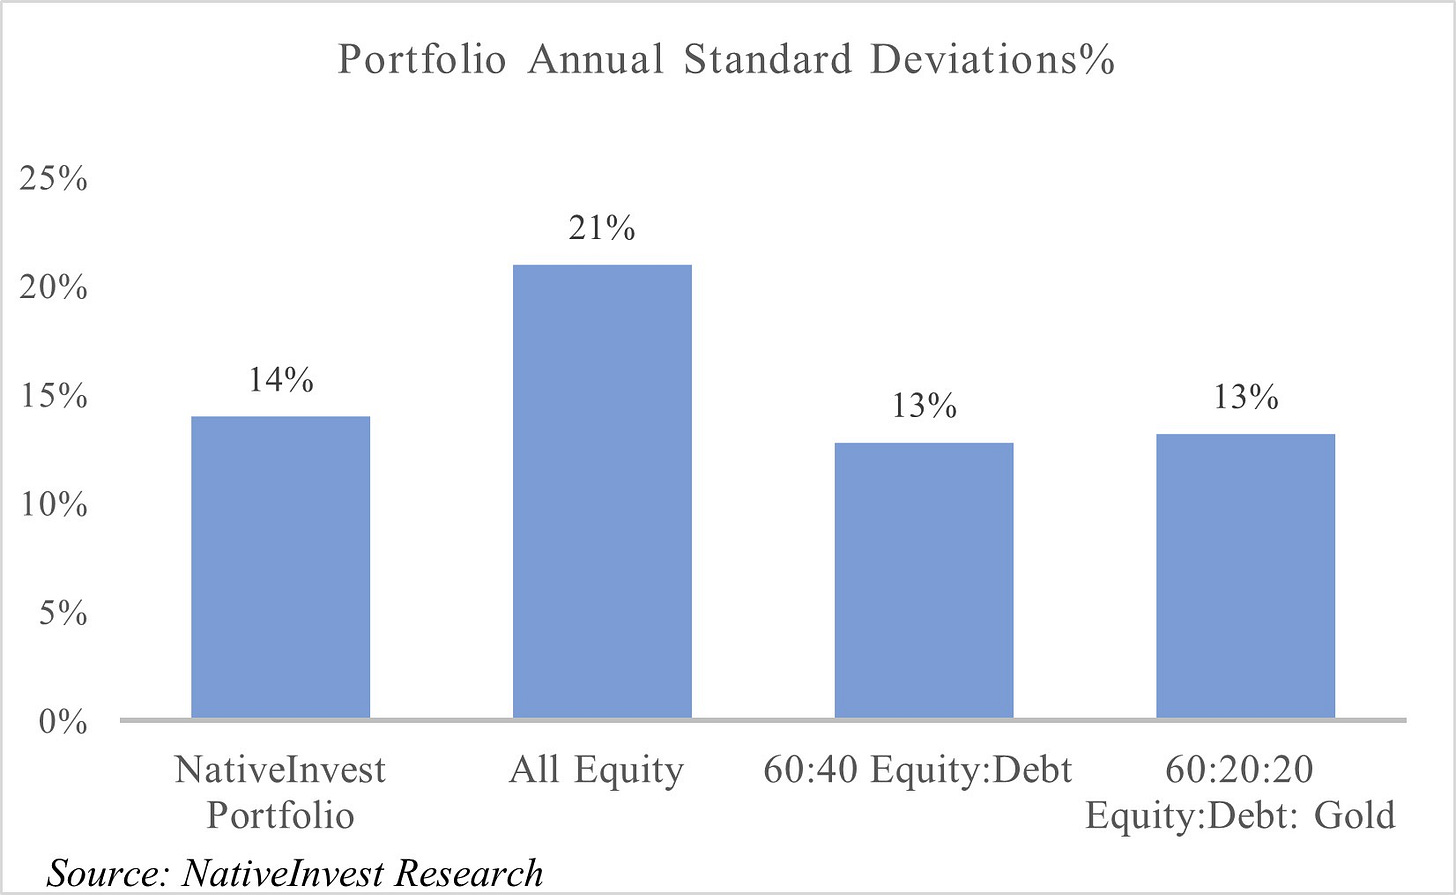
Our Model Portfolio generates total returns of 58,780% vs 13,300% for Equities, but at two-thirds the standard deviation (volatility measure). Compared to the traditional balanced portfolios, it generates significantly better returns but at the same standard deviation!
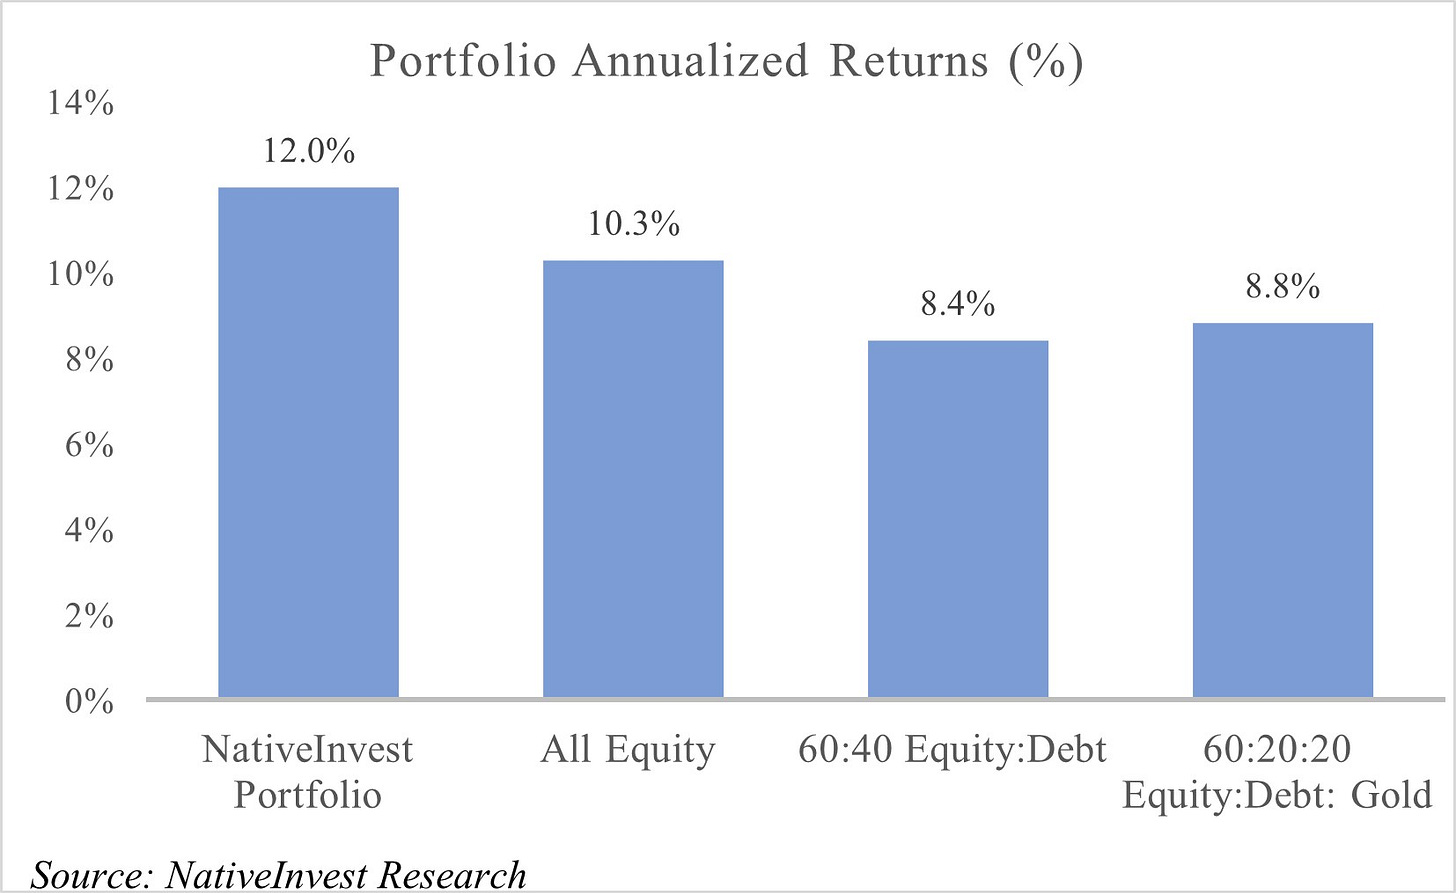
We should keep in mind that here the Model portfolio beats Equities without active stock picking and while being multi-asset. The Sharpe ratio for the Model Portfolio is at 0.9 vs 0.5 for Equities and 0.65 for other 2 balanced portfolios - hence demonstrates strong risk-adjusted performance.
The Model portfolio also has low churn rate: it rebalanced only ~7% of the time (82 months out of 1,180 months in the test period). We believe running a certain allocation for a continual period of time until conditions significantly change is highly beneficial. And we also limit transaction costs & taxes (though we have not modelled those here).
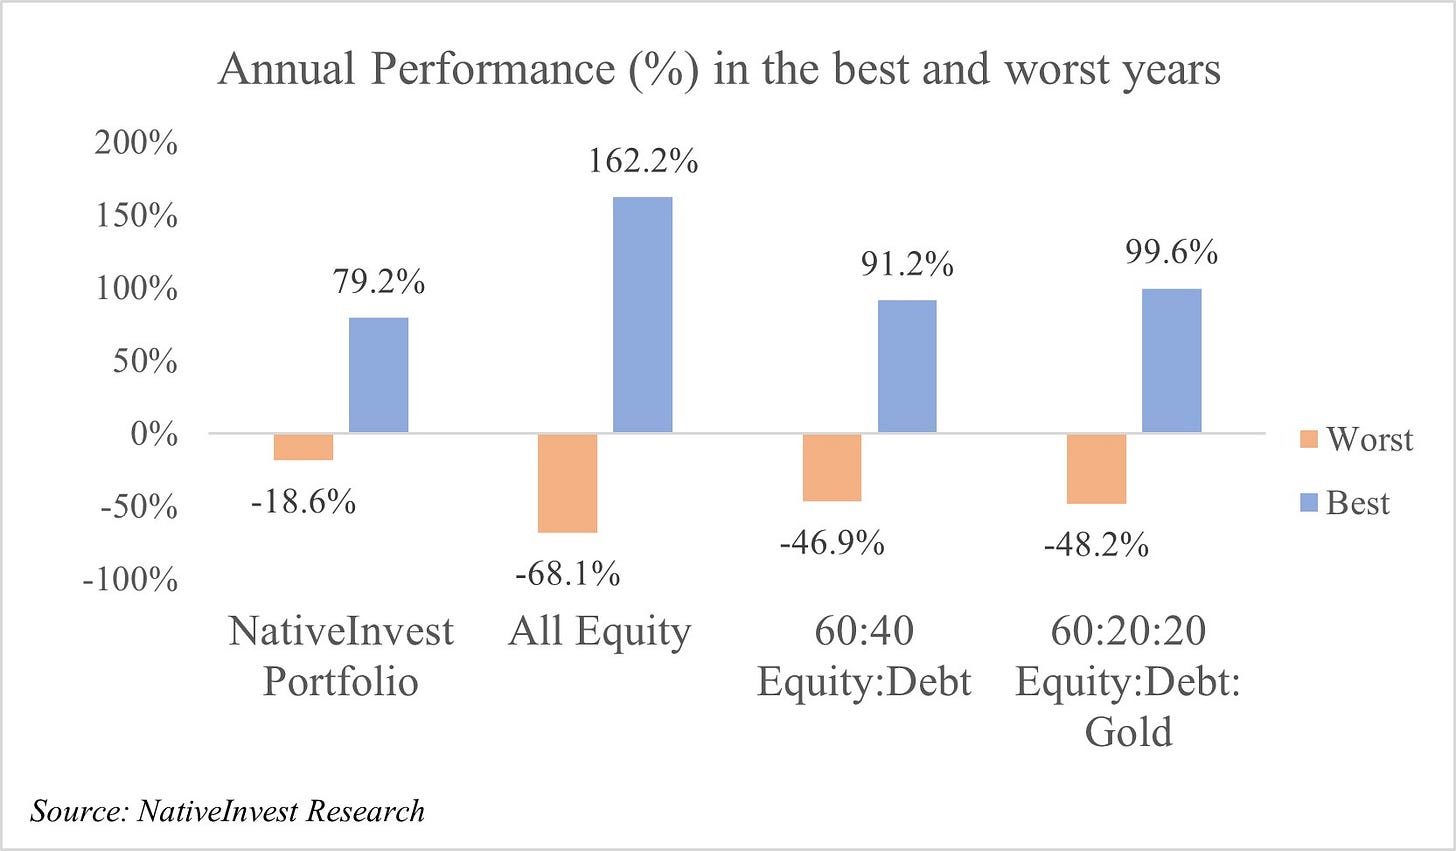
One important risk parameter that we have focused on is drawdowns - our aim was to have equity like returns with bond like risk. Model Portfolio’s highest annual drawdown for any year over the last 100 years is only -19% vs -68% for Equities and -47% for the other 2 balanced portfolios. This is possible because of the risk-first approach that we have taken in portfolio construction.
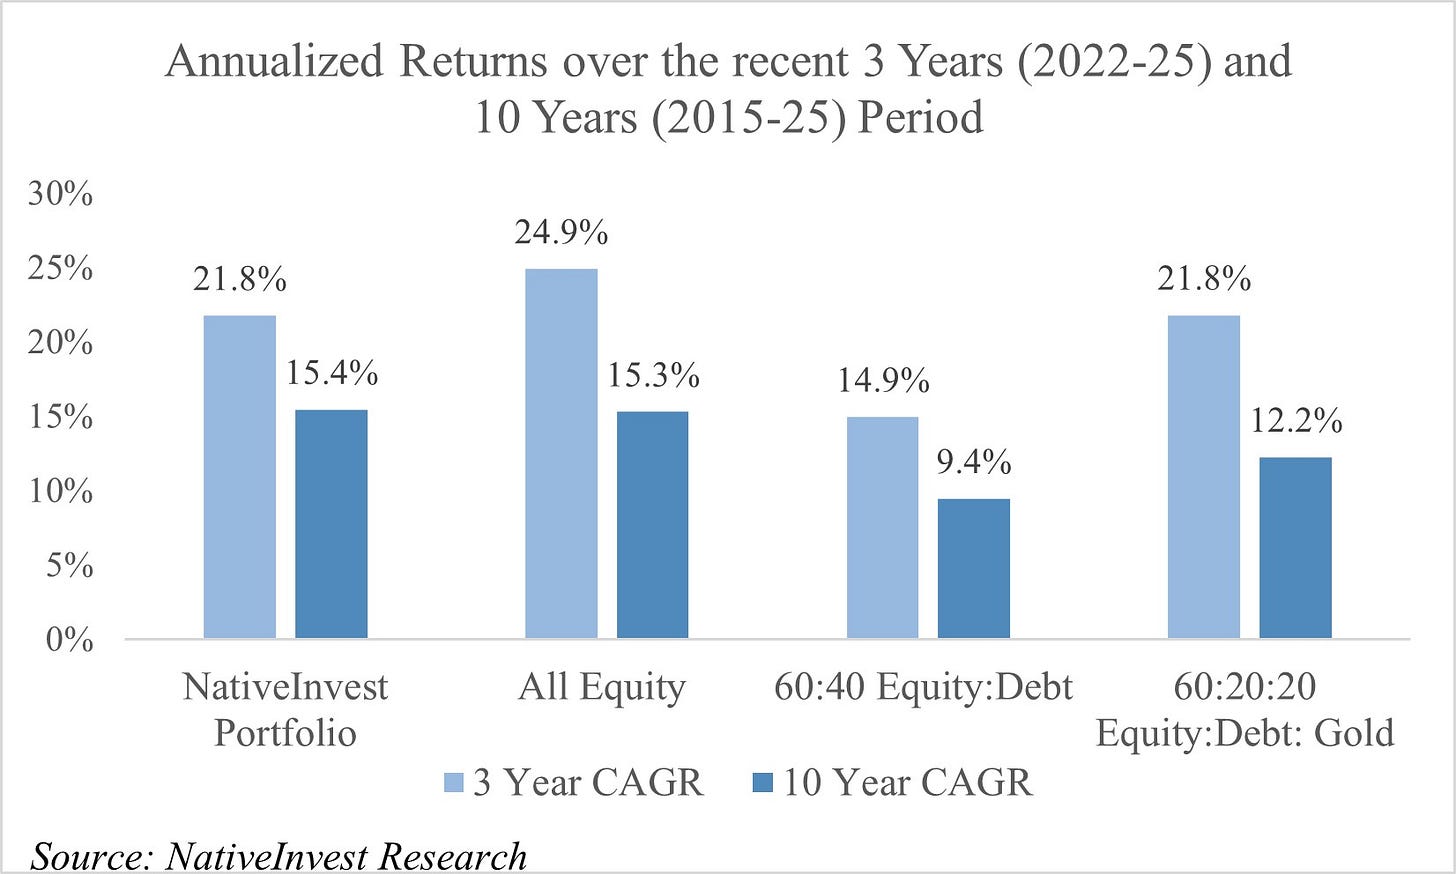
We also look at recent performance of the Model portfolio - over last 10 years, it has beaten the other 2 balanced portfolios and performed in-line with equities - but again with similarly lower standard deviation as above.
However, over the last 3 year period, it has under-performed Equities, and performed in line with the 60:20:20 portfolio, and better than the 60:40 portfolio. Underperformance vs equities is obviously driven by the Top-focused recent rally in the US markets where a handful of Tech & AI companies have driven the returns.
Key Inferences
Firstly that it is possible to beat the benchmark, even while being passive through smart allocation and strategies.
Secondly, while human insights and intuition have no match, but we have to accept, especially in this new world of AI, that there is room for quant and rule-based portfolios which take the decision out of humans and into a system, thereby eliminating a lot of bias and subjectivity.
Lastly, its all about execution. The strategy worked because it was implemented as is without any disturbance or exception - in real life it is much harder to implement the strategy 100% of the times - the devils of greed and fear will always stop us.
Conclusion
In conclusion, we would like to re-iterate that one should keep the pitfalls of a back-test & even quant portfolios in mind - we definitely do!
We are also not suggesting that active investing does not work - we have always been (and still are) fundamental-driven, bottoms-up active investors! But our point is that our entire portfolio need not be only one strategy and that along with active, there could be room for exploring an alternate quant-based passive strategy. That’s diversification from human decision-making & behavior!
We are also well aware of the Buffet quote: “If history was all that was to the game, then librarians would be the richest!” But we believe that we should always learn from actions of our heroes and not from their one liner quotes. Let’s look at his Apple investment - everyone knows it is Berkshire’s largest position and most profitable one. But he did not invest in Apple in 2007 when they had just launched the iPhone, nor in the crash of 2008 when valuation-wise it was may be the cheapest, rather he invested, and invested big, in 2018 - only after he had enough ‘history’ to validate and be comfortable about the product & company’s future cash flows. So except for Angel Investors and Venture Capitalists, no one is investing without looking at history - just that everyone looks at different histories and in a different way!
Hence, we think it is possible to learn from past data, fine-tune it on an on-going basis and develop it into a rule-based strategy that hopefully works!
Disclaimer: This is purely for education & research purposes only. Nothing in this should be considered as an investment advice. Please consult your SEBI-registered investment advisor before taking any financial decisions.