
Insights
Niche Manufacturing Plays: When the side show becomes the main business
Three listed Indian companies are quietly re-imagining themselves around precision manufacturing — inside businesses the market still prices as something else entirely. A look at KDDL, Raymond, and ASM Technologies.

In this article
- The Thesis
- KDDL Limited
- Raymond Limited
- ASM Technologies Limited
- Same Playbook, Different Stage of Execution
- Key Risks to the Thesis
The Thesis
Each of these three companies carries a legacy identity that no longer describes where its economics actually come from. KDDL is best known as the holding structure behind Ethos, India's largest luxury watch retailer — but the profit engine increasingly sits in Eigen, its precision engineering arm. Raymond spent a century as a textile and suiting house; after demerging its Lifestyle and Realty businesses, what remains is an aerospace, defence, and auto-components manufacturer wearing an old name. ASM Technologies built its book as an IT and engineering-services consultancy to global semiconductor-equipment makers; it is now converting that domain knowledge into an actual manufacturing base under India's ESDM (Electronics System Design & Manufacturing) push.
The common thread is a shift from services, retail, or legacy consumer categories toward capital-intensive, export-oriented precision manufacturing feeding aerospace, auto, semiconductor, and industrial supply chains — several of them riding the "China+1" and Make in India localisation themes. This note profiles each company's manufacturing engine, its products and target end-markets, and the financial trajectory of that engine specifically, alongside the standard risks of a re-rating that depends on execution.
At a Glance — FY26
Company | Legacy Identity | Manufacturing Engine | FY26 Revenue | Mfg. Segment Growth | Order Book / Runway |
|---|---|---|---|---|---|
KDDL (standalone) | Ethos holding co. / watch components | Eigen — Precision Engineering | ₹496 cr (+34% YoY) | Eigen: +35% YoY | 20–25% CAGR guided (Eigen) |
Raymond (consolidated) | Textile & branded apparel | JKMGAL — Aerospace & Defence | ₹2,212 cr (+14% YoY) | A&D: +26% YoY | ₹2,350+ cr (5-yr, A&D) |
ASM Technologies (consolidated) | IT & engineering services consultancy | Design-Led Manufacturing (ESDM) | ₹529 cr (+83% YoY) | Consol.: +83% YoY | ₹510 cr Karnataka capex MoU |
KDDL Limited
NSE / BSE: 532054 · Chandigarh · Est. 1981 · Gems, Jewellery & Watches
Holding structure for Ethos (luxury watch retail)
→
Precision engineering + watch-component manufacturer
KDDL is popularly discussed as "the company behind Ethos" — its separately listed luxury watch-retail subsidiary. That framing undersells the manufacturing core. KDDL is one of the world's largest independent manufacturers of watch dials, hands, indexes and bracelets (brands: Taratec-KDDL, Estima), a growing luxury packaging business (Ornapac), and — the fastest-growing and most strategically important piece — Eigen, its precision engineering division, which makes high-precision metal-stamped components and tooling for automotive, aerospace, industrial and alternate-energy customers, largely for export to the US and Europe.
Products, Uses & Target Industries
Division / Brand | Products | Use / Target Industry |
|---|---|---|
Eigen | High-precision stamped metal components, tool & die manufacturing, complex sub-assemblies (incl. electroplated parts) | Automotive components, aerospace parts, general industrials, alternate/renewable energy equipment — export-led (US & European OEMs) |
Taratec-KDDL / Estima | Watch dials, hands, indexes, appliques | Swiss, Indian and Japanese luxury & premium watch brands |
Bracelets (new division) | Metal and composite watch bracelets | Swiss mid-to-high-end watch brands; ramping toward full capacity utilisation |
Cases & Related Parts | Watch cases and related precision components | Swiss watch industry, benefiting from China+1 sourcing shift |
Ornapac | Luxury and sustainable packaging | Global watch and jewellery brands |
Ethos (subsidiary, listed separately) | Multi-brand luxury watch retail | Indian luxury watch consumers — ~90+ boutiques, expansion planned |
Eigen — Precision Stamping ₹200 cr
FY26 revenue, +35% YoY · 5 end-markets: electronics, aerospace, automotive, consumer durables, industrial
Dials, Hands & Indexes 10–12%
Guided CAGR, 5–7 yrs · Swiss, Indian & Japanese luxury/premium watch brands
Bracelets (New Division) ~₹40 cr
Capacity expanding 75K → 110–120K units/yr over next 12 months
Ornapac — Packaging ₹80–100 cr
Medium-term opportunity · sustainable luxury packaging for watch & jewellery brands
Basis: KDDL LIMITED STANDALONE ONLY — excludes Ethos, Estima, Mahen Distribution, Kamla Int. Holdings, Silvercity Brands (Favre Leuba) and other subsidiaries
Everything below isolates the parent entity — Taratec dials/hands/indexes/bracelets, Eigen precision engineering, and Ornapac packaging, all run out of KDDL Limited itself. Ethos and the other subsidiaries are separately listed or held entities with their own P&Ls; consolidating them back in would flatter the manufacturing story with retail economics that behave very differently. Figures are drawn from a Screener.in standalone data export and cross-checked against KDDL's own Q4 & FY26 investor presentation (19 May 2026). EBITDA throughout this section is Screener's "Operating Profit" line (Sales less operating expenses, before other income, depreciation and interest) — i.e. EBITDA is treated as equal to Operating Profit.
Standalone Revenue vs EBITDA — 5 Year Trend
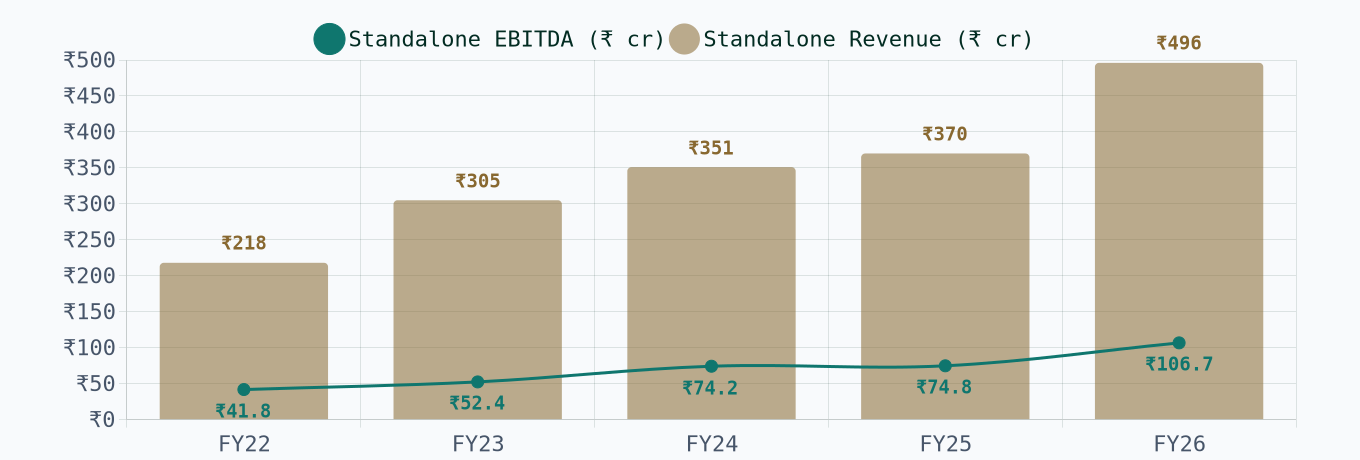
FY24 EBITDA (₹74.2 cr) is understated relative to what KDDL itself has cited in some investor materials, because this Excel-derived figure keeps a ~₹19.6 cr impairment charge and other one-off items inside operating expenses rather than backing them out — see the FY24 PAT note in the quarterly/annual tables below for the full one-off breakdown.
Standalone EBITDA Margin — 5 Year Trend
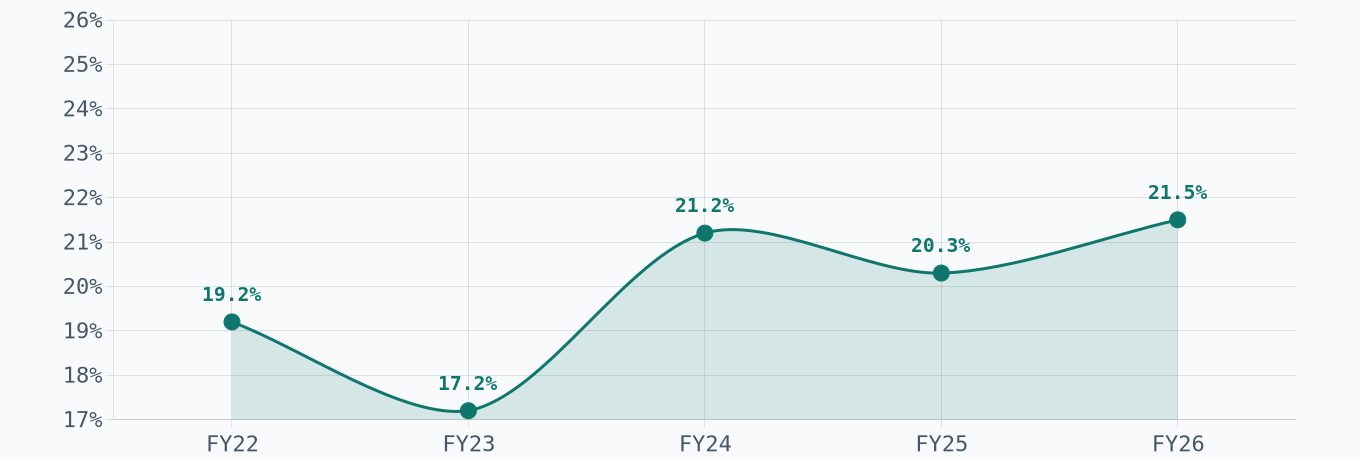
₹200 cr
Eigen (Precision Eng.) revenue, FY26 · +35% YoY
20–25%
Eigen CAGR guided, medium term
52.6x
Standalone P/E (FY26 EPS)
37.1x
Standalone EV/EBITDA (FY26)
Standalone Financials — Last 8 Quarters
₹ crore | Q1 FY25 | Q2 FY25 | Q3 FY25 | Q4 FY25 | Q1 FY26 | Q2 FY26 | Q3 FY26 | Q4 FY26 |
|---|---|---|---|---|---|---|---|---|
Sales | 81 | 92 | 97 | 99 | 110 | 123 | 116 | 147 |
Sales YoY | n.a. | n.a. | +19.8% | +12.4% | +35.3% | +33.1% | +19.0% | +49.1% |
EBITDA | 15 | 21 | 22 | 16 | 21 | 25 | 23 | 39 |
EBITDA YoY | n.a. | n.a. | +16.3% | +147.8%§ | +34.0% | +19.1% | +2.3% | +140.9%§ |
EBITDA Margin | 19% | 23% | 23% | 16% | 19% | 20% | 20% | 26% |
PBT | 13 | 20 | 14 | 11 | 16 | 20 | 35‡ | 27 |
PAT | 10 | 15 | 16 | 8 | 12 | 14 | 30‡ | 20 |
PAT YoY | n.a. | n.a. | +22.7% | (95.3%)§ | +21.9% | (4.3%) | +88.8%‡ | +140.2% |
PAT Margin | 12.3% | 16.3% | 16.5% | 8.1% | 10.9% | 11.4% | 25.9%‡ | 13.6% |
Source: Screener.in standalone quarterly export; EBITDA = Operating Profit as reported there. YoY compares each quarter with the same quarter a year earlier; Q1/Q2 FY25 show n.a. because the underlying export's earliest available quarter is Q3 FY24. ‡Q3 FY26 PBT/PAT include an ₹18 cr one-off dividend from Mahen Distribution Ltd — underlying PBT before that item was closer to ₹16.5 cr, which is why its YoY reads inflated. §Q4 FY25 EBITDA/PAT YoY are measured against Q4 FY24, which itself included a large one-off gain (Ethos stake sale) inside that quarter's PAT — both the Q4 FY25 EBITDA YoY (base-effect inflated) and PAT YoY (base-effect deflated) should be read with that in mind rather than as underlying operating trends.
Standalone Balance Sheet & Return Ratios — 3 Year (FY24–FY26)
Particulars | FY24 | FY25 | FY26 | FY24–26 CAGR |
|---|---|---|---|---|
P&L | ||||
Sales | 350.6 | 369.6 | 495.8 | +18.9% |
Sales YoY | n.a. | +5.4% | +34.2% | |
EBITDA◊ | 74.2 | 74.8 | 106.7 | +19.9% |
EBITDA YoY | n.a. | +0.8% | +42.6% | |
EBITDA Margin | 21.2% | 20.3% | 21.5% | +0.3pp |
PBT | 254.0† | 58.8 | 96.5 | (38.4%)† |
PAT | 220.0† | 49.2 | 76.6 | (41.0%)† |
PAT YoY | n.a. | (77.6%)† | +55.6% | |
PAT Margin | 61.1%† | 12.8% | 15.1% | (46.0pp)† |
Balance Sheet | ||||
Net Worth | 397.1 | 331.4 | 383.9 | (1.7%) |
Net Debt‡ | (207.5) | (45.1) | (60.9) | n.m. |
Net Block | 136.1 | 145.8 | 152.6 | +6.0% |
Net Working Capital | 74.0 | 98.4 | 138.6 | +36.9% |
Avg. NWC Days | 76 | 85 | 87 | +11d |
Returns & Cash Conversion | ||||
ROCE◊ | 12.9% | 12.1% | 15.8% | +2.9pp |
ROE | 67.7%† | 13.5% | 21.4% | (46.3pp)† |
CFO / EBITDA◊ | 107.4%† | 20.4% | 43.2% | (64.2pp)† |
FCF / EBITDA◊ | 59.2%† | (12.1%) | 18.7% | (40.5pp)† |
Net Worth = Equity Share Capital + Reserves. Net Debt = (Non-current + Current Borrowings) − Cash & Bank Balances − Investments. Net Block = Property, Plant & Equipment + CWIP. Net Working Capital = Trade Receivables + Inventories − Trade Payables; Avg. NWC Days = Average(opening, closing NWC) ÷ Revenue × 365. ROCE = EBIT ÷ Average(opening, closing Capital Employed), Capital Employed = Total Assets − Current Liabilities; the FY24–26 Capital Employed base is backed out from KDDL's own previously-disclosed ROCE and is held constant while EBIT is rebased to the Excel-sourced EBITDA below. ROE = PAT ÷ Average Net Worth. CFO and FCF from KDDL's standalone cash flow statement (Screener.in export); FCF = CFO − net capex. CAGR column is a 2-year (FY24→FY26) compound annual growth rate for absolute (₹ cr / days) rows; for margin and ratio rows already expressed in %, it instead shows the plain percentage-point (pp) change over the same period, labelled accordingly — a CAGR of a margin isn't a meaningful number, so this substitution keeps the column honest. ◊EBITDA throughout = Screener's "Operating Profit" (Sales − operating expenses, before other income/depreciation/interest); ROCE, CFO/EBITDA and FCF/EBITDA are recomputed on this basis rather than on any higher EBITDA figure KDDL itself may cite in investor materials. †FY24 figures are distorted by one-off items — a ₹121.7 cr gain on an open-market Ethos stake sale and a ₹72.1 cr interim dividend from Mahen Distribution, net of a ₹19.6 cr impairment charge that sits inside operating expenses (and therefore also depresses the FY24 EBITDA/ROCE/CFO-EBITDA figures above) — so every CAGR/Δ column touching FY24 PBT, PAT, PAT Margin, ROE, CFO/EBITDA or FCF/EBITDA is a distorted read on underlying trend, not a clean one. ‡KDDL's "Investments" are largely strategic holdings in group entities (Ethos, Mahen Distribution, Estima, etc.), not liquid securities — net debt excluding investments (Borrowings less Cash only) would instead read as net cash of ~₹74 cr in FY24, and net debt of ~₹85 cr (FY25) and ~₹95 cr (FY26).
Valuation Snapshot
₹4,024 cr
Market Cap
₹3,272
Price (latest)
52.6x
Standalone P/E
37.1x
Standalone EV/EBITDA
EV = Market Cap + Net Debt (standalone, incl. investments, per definition above) = ₹4,024 cr − ₹61 cr = ₹3,963 cr. EV/EBITDA uses the Excel-sourced standalone EBITDA of ₹106.7 cr. Market capitalisation prices the whole listed entity, including KDDL's stake in Ethos and other subsidiaries — since standalone EPS/EBITDA exclude those subsidiaries' earnings, these standalone-basis multiples read structurally higher than a sum-of-the-parts view would show, and are not directly comparable to peer multiples computed on a consolidated basis.
Sum-of-the-Parts: Stripping Out the Ethos Stake
The point above cuts both ways — if the market cap embeds Ethos, then backing Ethos's value out should reveal what the market is really paying for the manufacturing business alone. Ethos Limited's own market cap has recently run around ₹7,000 cr; KDDL holds roughly a 43% stake in it (publicly disclosed figures put KDDL's direct holding at 47.03%, or ~50% combined with wholly-owned subsidiary Mahen Distribution — 43% is used here as the working assumption for this exercise). Applying a conventional 30–35% holding-company discount to that stake (illiquidity, no direct control over cash flows, tax drag on any exit) values KDDL's Ethos stake at roughly ₹2,000 cr.
Bridge (₹ crore) | Value |
|---|---|
Ethos Limited — market cap | 7,000 |
KDDL's stake in Ethos | 43% |
Value of stake, pre-discount | 3,010 |
Holding-company discount | 30–35% |
Value of Ethos stake to KDDL | ~2,000 |
KDDL Limited — market cap (total) | ~4,000 |
Less: value of Ethos stake | (2,000) |
Implied value of manufacturing business | ~2,000 |
~₹2,000 cr
Implied Mfg. Business Value
26.1x
Implied P/E (on ₹2,000 cr, FY26 standalone PAT)
19.6x
Implied EV/EBITDA (FY26 standalone EBITDA)
Implied P/E = ₹2,000 cr ÷ FY26 standalone PAT (₹76.6 cr) = 26.1x. Implied EV/EBITDA uses EV = ₹2,000 cr equity value + ₹95 cr net debt (Borrowings less Cash only — investments are excluded here since the Ethos stake, the main investment, is already valued separately above) ÷ FY26 standalone EBITDA (₹106.7 cr, Excel-sourced) = 19.6x. Both read meaningfully cheaper than the plain standalone-basis multiples above (52.6x / 37.1x) — which is the point of doing the sum-of-the-parts exercise: on a market-cap-less-Ethos-stake basis, KDDL's manufacturing engine (Eigen precision engineering + Taratec watch components + Ornapac packaging) looks far less expensive than the headline standalone P/E suggests. This is illustrative — Ethos's own market cap moves daily, KDDL's disclosed stake and the appropriate holdco discount are both open to debate, and none of this is a target price.
Share Price — Last 1 Year
KDDL — Daily Closing Price (₹)
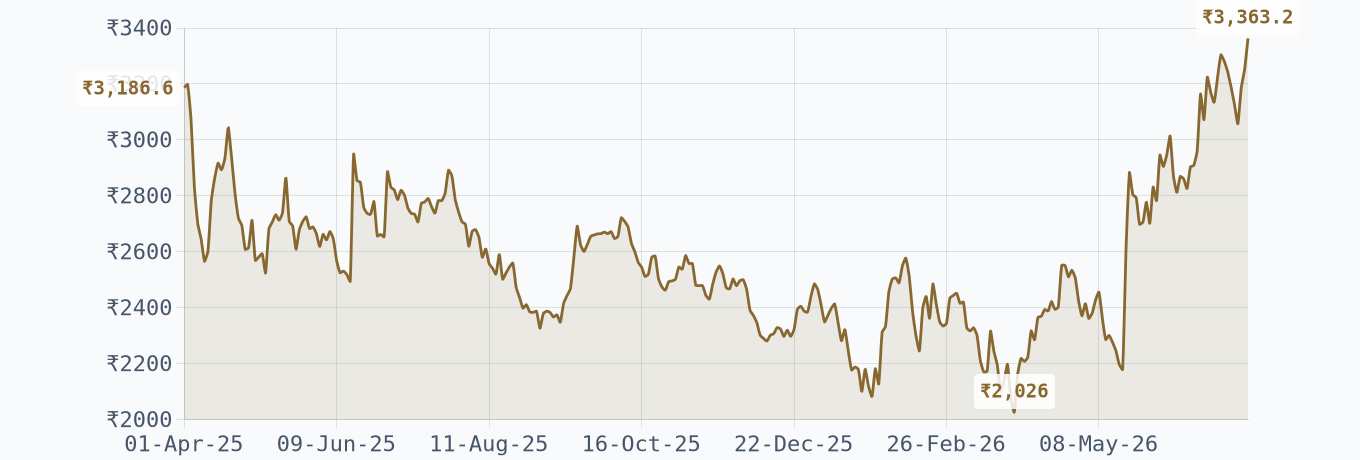
Daily NSE closing prices, 1 Apr 2025–13 Jul 2026 (315 trading days), plotted day-by-day rather than at month-ends; labelled points mark the period's open, peak, trough and latest close. Period high ₹3,363.20 (13 Jul 2026, i.e. the most recent close); period low ₹2,026.00 (30 Mar 2026). Company-disclosed trailing 52-week high/low (to 13 Jul 2026): ₹3,416 / ₹1,990.
Growth Outlook by Division (Management Guidance)
Dials & Hands: 10–12% CAGR over 5–7 years on rising Swiss/Indian/Japanese orders. Bracelets: strong growth targeted, ₹80–100 cr revenue opportunity as the new division approaches full capacity. Cases & Related Parts: ₹50–75 cr medium-term opportunity from Swiss market growth and China+1 sourcing. Eigen (Precision Engineering): 20–25% CAGR, the fastest-growing and highest-strategic-priority segment, on rising demand for complex precision parts from US/European customers. Ornapac packaging: ₹80–100 cr opportunity on sustainable-packaging demand from watch and jewellery brands.
Raymond Limited
NSE / BSE: RAYMOND · Mumbai · Est. 1925 · Engineering — Aerospace, Defence & Auto Components
Century-old textile & branded apparel conglomerate
→
Aerospace, defence & precision auto-components manufacturer
Basis: Raymond Limited, consolidated — figures below are as filed; several periods are distorted by the Lifestyle (Sep 2024) and Realty (May 2025) demergers, flagged throughout
Raymond has spent two years dismantling the conglomerate that made its name. The Lifestyle business (apparel, garmenting, FMCG) was demerged and separately listed in September 2024; the Realty business followed in May 2025. What is left inside "Raymond Limited" is the Engineering business — built around the 2024 acquisition of Maini Precision Products (MPP), since split into JK Maini Global Aerospace (JKMGAL) and JK Maini Precision Technologies (JKMPTL) — plus the legacy JK Files tools & hardware business. Chairman Gautam Singhania has publicly framed this as "Raymond 2.0": an engineering-led company built around aerospace, defence and precision components.
Products, Uses & Target Industries
Division | Products | Use / Target Industry |
|---|---|---|
JKMGAL | Stator vanes, engine housings, flap tracks, fuel-system assemblies, landing-gear components, structural assemblies, engine mounts, precision-machined fittings — 1,200+ SKUs | Commercial & defence aircraft engines and airframes (fixed-wing and rotary). Over 75% of products feed the engine segment. Customers include Safran, Airbus-linked supply chain, Thales, Eaton |
JKMPTL | Precision-machined automotive components, industrial and hydraulic parts, general/defence engineering components | Automotive OEMs (legacy relationships with GM, Bosch), industrial machinery, defence, general engineering — mobility platforms including EV-related components |
JK Files & Tools | Precision files and cutting tools, power-tool accessories | Industrial tooling, wholesale/retail hardware — exports to 55+ countries; domestic distribution via 10,000+ outlets |
JKMGAL — Aero Engine Parts
1,300+
Precision aero-engine parts developed, incl. 350+ across the latest LEAP variants
JKMPTL — Ring Gears
#1 in India
~55% share in passenger vehicles, ~45% in commercial vehicles
JK Files & Tools
#1 in India
~65% India, ~25% global share in steel files; 6,800+ SKUs across files, drills, hand & power tools
Gudipalli, Andhra Pradesh
₹930 cr
Combined 5-yr capex — ₹500 cr (A&D) + ₹430 cr (Auto Components), commercial production targeted late 2027
EBITDA throughout this section is Screener's "Operating Profit" line (Sales less operating expenses, before other income, depreciation and interest) — treated as equal to EBITDA. Raymond's own investor presentation discloses segment EBITDA on a somewhat broader basis (₹335 cr / 14.5% margin, consolidated, FY26) that includes items this narrower Excel-derived figure doesn't — where the two diverge, both are shown and flagged.
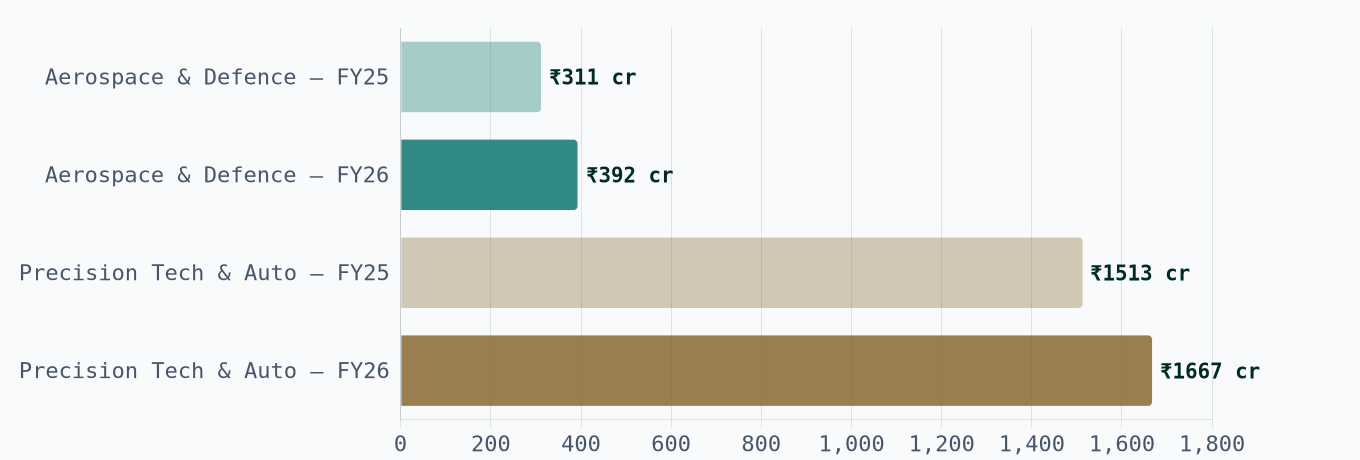
Segment Revenue — Auto Components vs. Aerospace & Defence, FY25 vs FY26 (₹ crore)
Segment EBITDA Margin — Auto Components vs. Aerospace & Defence (FY25/FY26 & Q4)
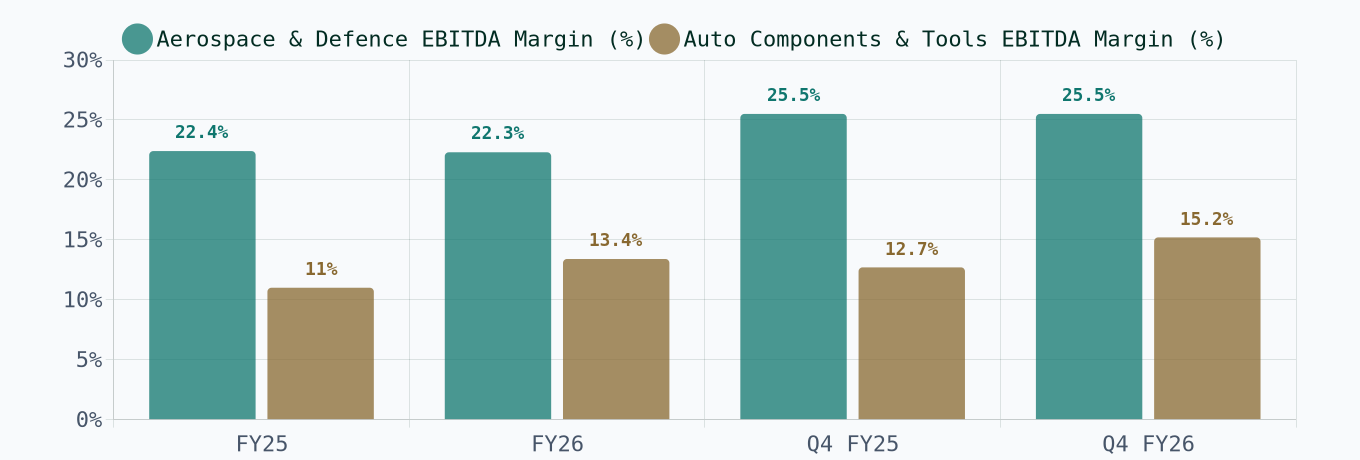
Segmental Split — Auto Components & Tools/Hardware vs. Aerospace & Defence
Raymond's Engineering business reports as two distinct operating segments, restructured in 2025 into separate subsidiaries — JK Maini Precision Technology Ltd. (JKMPTL), covering Auto Components plus the legacy Tools & Hardware (JK Files) division, and JK Maini Global Aerospace Ltd. (JKMGAL), covering Aerospace & Defence. The two run at very different scale and margin profiles: Auto Components/Tools is ~4.3x larger by revenue but Aerospace & Defence carries roughly 9 percentage points higher EBITDA margin and is compounding faster.
₹ crore | Q4 FY25 | Q4 FY26 | YoY | FY25 | FY26 | YoY |
|---|---|---|---|---|---|---|
Precision Technology & Auto Components (JKMPTL) | ||||||
Revenue | 421 | 442 | +5% | 1,513 | 1,667 | +10% |
EBITDA | 53 | 67 | +26% | 167 | 223 | +34% |
EBITDA Margin | 12.7% | 15.2% | +250bps | 11.0% | 13.4% | +240bps |
Aerospace & Defence (JKMGAL) | ||||||
Revenue | 107 | 119 | +11% | 311 | 392 | +26% |
EBITDA | 27 | 30 | +11% | 70 | 88 | +25% |
EBITDA Margin | 25.5% | 25.5% | flat | 22.4% | 22.3% | (10bps) |
Engineering Business Total (incl. Others / unallocated) | ||||||
Revenue | 601 | 613 | +2% | 2,105 | 2,312 | +10% |
EBITDA | 99 | 85 | (14%) | 335 | 335 | 0% |
EBITDA Margin | 16.4% | 13.9% | (250bps) | 15.9% | 14.5% | (140bps) |
Source: Raymond Limited Q4FY26 & FY26 Results Presentation, 5 May 2026 (company-disclosed segment figures, distinct from the Screener-derived "as-filed" numbers in the quarterly table further below). "Others" is unallocated corporate expenses, inter-segment eliminations and other income — it swung from +₹18 cr in Q4 FY25 to (₹13 cr) in Q4 FY26, which is why the blended consolidated margin fell even though both operating segments individually expanded or held margin.
Geography-wise Revenue Split — FY26
Segment | Domestic | International | — Europe | — US | — Asia | — Africa |
|---|---|---|---|---|---|---|
Precision Tech & Auto Components | 42% | 58% | 34% | 13% | 6% | 5% |
Aerospace & Defence | 21% | 79% | 58% | 20% | 1% | — |
Source: Raymond FY26 results presentation, geography-wise revenue split. Aerospace & Defence is markedly more export- and Europe-weighted than Auto Components, consistent with a customer base concentrated among global Tier-1 aero-engine OEMs and suppliers based in Europe and the US.
Market position, FY26 investor presentation: In Aerospace & Defence, JKMGAL has developed 1,300+ precision aero-engine parts, including 350+ parts across the latest LEAP engine variants, and is a preferred supplier to the top 3 global aircraft-engine manufacturers (a combined ~88% market share) across 25+ global client relationships. Q4 FY26 marked its first build-to-spec order (specialised onboard storage systems for a defence aerospace OEM) and the onboarding of a new American Tier-1 engine manufacturer as customer, alongside continued progress with a European Tier-1 engine manufacturer. In Auto Components & Tools/Hardware, JKMPTL is India's #1 manufacturer of Ring Gears (~55% share in passenger vehicles, ~45% in commercial vehicles) and, through the legacy JK Files franchise, India's #1 supplier of steel files (~65% domestic share, ~25% global share); it secured a new nomination from a European advanced-drivetrain technology company in FY26 and was recognised by a leading Auto Tier-1 for long-term collaboration.
₹1,667 cr
Auto Components & Tools revenue, FY26 · +10% YoY
₹392 cr
Aerospace & Defence revenue, FY26 · +26% YoY
₹2,350+ cr
A&D order book, next 5 years
₹68 cr
Net cash surplus · debt-free
Capacity & Order Book
The Aerospace & Defence segment (EBITDA margin 22.3%, broadly stable) carries an order book exceeding ₹2,350 crore over the next five years, with management targeting a doubling of the aerospace business within 3–4 years. A greenfield facility at Gudipalli, Andhra Pradesh (near Bengaluru airport) is under construction with a ₹500 crore capex plan over 5 years, ground-breaking already complete and commercial production targeted for late 2027. Precision Technology & Auto Components delivered stronger margin expansion (EBITDA +34% YoY to ₹223 cr, margin up to 13.4% from 11.0%) and is building a separate, adjacent Gudipalli facility of its own — 13.07 lakh sq ft on a ₹430 crore capex plan over 5 years, also targeting late-2027 commercial production — alongside a newly built go-to-market network across Southeast Asia for the Tools & Hardware business.
Last 8 Quarters
₹ crore | Q1 FY25 | Q2 FY25 | Q3 FY25 | Q4 FY25 | Q1 FY26 | Q2 FY26 | Q3 FY26 | Q4 FY26 |
|---|---|---|---|---|---|---|---|---|
Sales | 449.8 | 473.6 | 466.1 | 557.5 | 524.3 | 527.7 | 557.2 | 602.9 |
Sales YoY | n.a.◊ | n.a.◊ | (31.3%)◊ | +109.7%◊ | +16.6% | +11.4% | +19.5% | +8.2% |
EBITDA | 31.6 | 24.9 | 31.3 | 44.5 | 54.2 | 43.0 | 59.8 | 74.3 |
EBITDA YoY | n.a.◊ | n.a.◊ | (45.0%)◊ | +356.7%◊ | +71.7% | +72.8% | +91.2% | +67.1% |
EBITDA Margin | 7.0% | 5.3% | 6.7% | 8.0% | 10.3% | 8.2% | 10.7% | 12.3% |
PBT | 7,374.7† | 68.2 | 72.8 | 146.3 | 5,335.7† | (148.3) | 10.1 | 4.2 |
PAT | 7,366.5† | 60.1 | 72.1 | 132.8 | 5,325.2† | 11.4 | 3.6 | 1.1 |
PAT Margin | n.m.† | 12.7% | 15.5% | 23.8% | n.m.† | 2.2% | 0.6% | 0.2% |
Source: Screener.in consolidated quarterly export; EBITDA = Screener's "Operating Profit" line. PAT YoY isn't shown — the Lifestyle/Realty demerger gains sit in different quarters on each side of most of these comparisons, which would make a PAT YoY% actively misleading rather than merely noisy. †Q1 FY25 and Q1 FY26 PBT/PAT are dominated by non-cash accounting gains tied to the Lifestyle and Realty demergers respectively — treat as not meaningful (n.m.) for operating purposes. ◊Q3/Q4 FY25 YoY figures compare against Q3/Q4 FY24, when Raymond's engineering business was still being folded in as continuing operations alongside the businesses that were later demerged — both the sharp Q3 FY25 Sales/EBITDA decline and the Q4 FY25 spike are largely scope-change artefacts of that transition, not underlying operating swings. Q1/Q2 FY25 show n.a. because the underlying export's earliest available quarter is Q3 FY24.
Balance Sheet & Return Ratios — 2 Year (FY25–FY26)
Particulars | FY25 | FY26 |
|---|---|---|
P&L | ||
Sales | 1,946.8 | 2,212.1 |
Sales YoY | n.a.§ | +13.6% |
EBITDA◊ | 132.0 | 231.5 |
EBITDA YoY | n.a.§ | +75.4% |
EBITDA Margin◊ | 6.8% | 10.5% |
PBT | 7,661.9† | 5,201.8† |
PAT | 7,631.4† | 5,341.3† |
PAT — continuing ops (co.-disclosed) | ~52 | ~53 |
PAT YoY (continuing ops) | n.a.§ | +2% |
Balance Sheet | ||
Net Worth | 3,716.1¶ | 2,844.0 |
Net Debt‡ | (677.8) | (822.6) |
Net Block | 1,772.1 | 1,524.2 |
Trade Receivables + Inventory | 824.7 | 1,007.8 |
Returns & Cash Conversion | ||
ROCE# | (0.3%) | 2.0% |
ROE# | 1.4% | 1.9% |
CFO (₹ cr) | 233.1 | 41.8 |
◊EBITDA = Screener's "Operating Profit" (Sales − operating expenses, before other income/depreciation/interest); Raymond's own investor presentation discloses a higher consolidated EBITDA (₹335 cr / 14.5% margin, FY26; ₹310 cr / ~15.9%, FY25) on a somewhat broader basis — treat the company's own disclosed segment EBITDA (Aerospace & Defence 22.3% margin, Precision Technology & Auto Components 13.4%, both cited earlier in this section) as the more granular operating picture, and this table's EBITDA as the standardised, Excel-comparable one. §FY25 YoY figures are shown as n.a. because the FY24 base year in this dataset (₹972.6 cr Sales) is a partial-period figure — close to the sum of just two quarters (Dec-23 + Mar-24 ≈ ₹944 cr) rather than a full 12 months, reflecting when the precision-engineering/auto-components business was folded into continuing operations mid-year — so a FY24→FY25 growth rate would compare a part-year to a full year. †PBT/PAT are dominated by non-cash accounting gains tied to the Realty (FY25) and Lifestyle/Realty (FY26) demergers — see "PAT — continuing ops" for the company's own cleaner operating figure instead. ¶Unlike the P&L, Raymond's balance sheet in this data is not restated for the demergers — the FY25 balance sheet shown here still includes Raymond Realty (demerged 1 May 2025, just after FY25 year-end), so FY25 Net Worth/Net Block/Trade Receivables+Inventory aren't on the same entity basis as FY26's post-demerger figures; both years' numbers are shown as reported, but treat FY25→FY26 balance-sheet movements as a change in scope as much as a change in the business. ‡Net Debt = Borrowings − Cash & Bank − Investments (both years net cash-positive). #ROCE = (EBITDA − Depreciation) ÷ (Total Assets − Other Liabilities, closing, as a Capital Employed proxy since current liabilities aren't separately broken out in this data); ROE = PAT (continuing ops) ÷ Net Worth (closing). Both use closing rather than average balances, since FY24 isn't on a comparable entity basis to average against. Both read structurally low — FY25's negative ROCE reflects Depreciation (₹146 cr) exceeding this period's EBITDA (₹132 cr) during the post-acquisition/demerger transition, and FY26 ROCE/ROE are still held down by the same heavy depreciation load relative to a much smaller post-demerger capital base. These aren't comparable to KDDL's or ASM's ROCE/ROE, which are computed on cleaner, fully-restated data. Source: Screener.in consolidated exports (Profit & Loss, Balance Sheet, Cash Flow sheets).
Valuation Snapshot
₹4,231 cr
Market Cap
₹635.60
Price (latest)
~79.8x
P/E (on continuing-ops PAT)
14.7x
EV/EBITDA (Excel-sourced EBITDA)
P/E uses continuing-operations PAT (~₹53 cr FY26, per company commentary) rather than the as-reported EPS, which is distorted to near-meaninglessness by the demerger gain (raw P/E would compute to well under 1x). EV/EBITDA uses EV = Market Cap + Net Debt (₹4,231 cr − ₹823 cr net cash per the balance sheet above ≈ ₹3,408 cr) ÷ Excel-sourced EBITDA (₹231.5 cr) = 14.7x. On Raymond's own broader, company-disclosed consolidated EBITDA (₹335 cr) instead, EV/EBITDA would read ~10.2x — both readings put Raymond's engineering business on a materially cheaper multiple than ASM Technologies and a broadly similar one to KDDL's sum-of-the-parts figure.
Share Price — Last 1 Year
Raymond — Daily Closing Price (₹)
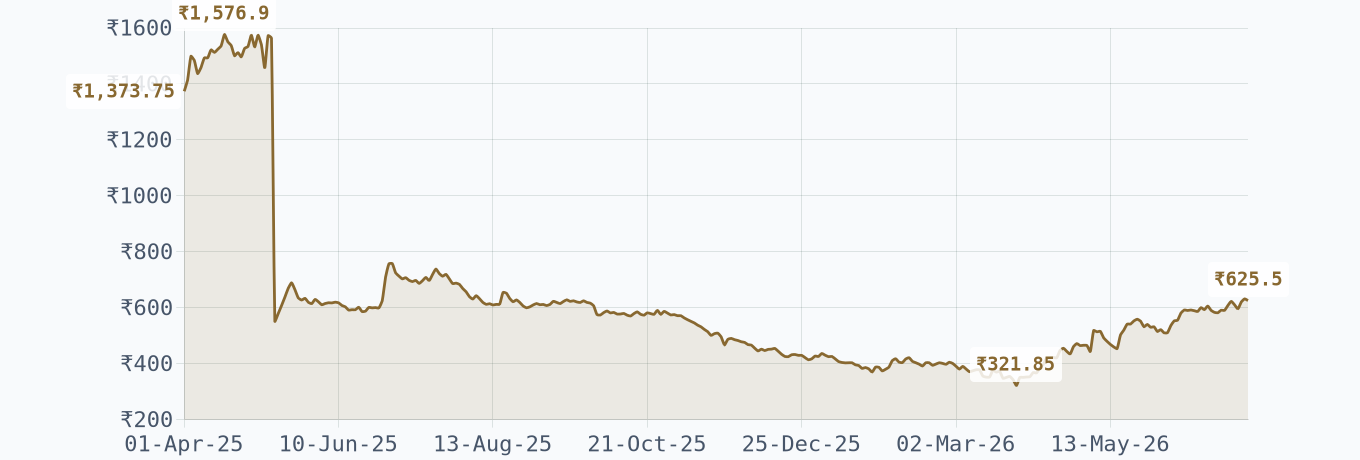
Daily NSE closing prices, 1 Apr 2025–13 Jul 2026 (318 trading days), plotted day-by-day rather than at month-ends; labelled points mark the period's open, peak, trough and latest close. The steep single-day drop visible around 30 Apr–1 May 2025 (₹1,527 → ₹630) is the Realty demerger taking effect — value moved to the separately listed Raymond Realty shares, it didn't evaporate. Period high ₹1,576.90 (22 Apr 2025, pre-Realty-demerger); period low ₹321.85 (30 Mar 2026). Company-disclosed trailing 52-week high/low (to 13 Jul 2026): ₹753 / ₹320.
ASM Technologies Limited
BSE: 526433 (NSE listing in-principle approved) · Bengaluru · Est. 1992 · IT Services → Design-Led Manufacturing
Engineering & product-R&D IT services consultancy
→
Design-Led precision & electronics manufacturer (ESDM)
ASM Technologies built a three-decade services book designing sub-systems for global semiconductor-equipment makers — ultra-high-precision chambers, vacuum technology, robotics, motion control, gas and flow-handling systems — without owning meaningful manufacturing capacity itself. That is now changing. The company has commissioned two new manufacturing facilities (Dabaspet, Karnataka and Sriperumbudur, Tamil Nadu, ~55,000 sq. ft. combined) and signed two state-government MoUs to build dedicated Design-Led Manufacturing (DLM) / Electronics System Design and Manufacturing (ESDM) capacity — ₹510 crore with Karnataka (10 acres, KIADB land) and a further ₹250 crore with Tamil Nadu (5 acres) — converting engineering IP built over 30 years into an owned precision-manufacturing base.
Products, Uses & Target Industries
Division | Products / Capabilities | Use / Target Industry |
|---|---|---|
Design-Led Manufacturing (new) | Precision-engineered sub-systems and components for electronics manufacturing; ESDM capacity for design, prototyping and competitive manufacturing | Electronics, semiconductor and solar equipment makers; part of India's Make in India / ESDM localisation push |
Semiconductor Equipment Engineering | Ultra-high-precision vacuum chambers, robotics, electronic motion control, gas & flow handling systems; PVD/CVD/RTP/Etch/CMP/Inspection sub-systems | Global semiconductor capital-equipment OEMs, and solar/display-panel equipment manufacturers |
Engineering Services (legacy, via Semcon India acquisition) | Product engineering, digital engineering and manufacturing-engineering consulting | Automotive, industrial, energy and life-sciences clients, with expanded reach into the Scandinavian/European market |
Precision Vacuum Chambers
30 yrs
Engineering track record in PVD/CVD/RTP/Etch/CMP sub-systems for global semiconductor-equipment OEMs
Design-Led Manufacturing
~55,000 sq ft
Dabaspet (Karnataka) + Sriperumbudur (Tamil Nadu) facilities, live today
ESDM Expansion — Karnataka + TN
₹760 cr
Combined MoU capex: ₹510 cr (Karnataka, 10 acres) + ₹250 cr (Tamil Nadu, 5 acres)
Basis: ASM Technologies Ltd, consolidated — single reporting entity, no separate standalone/subsidiary split of note
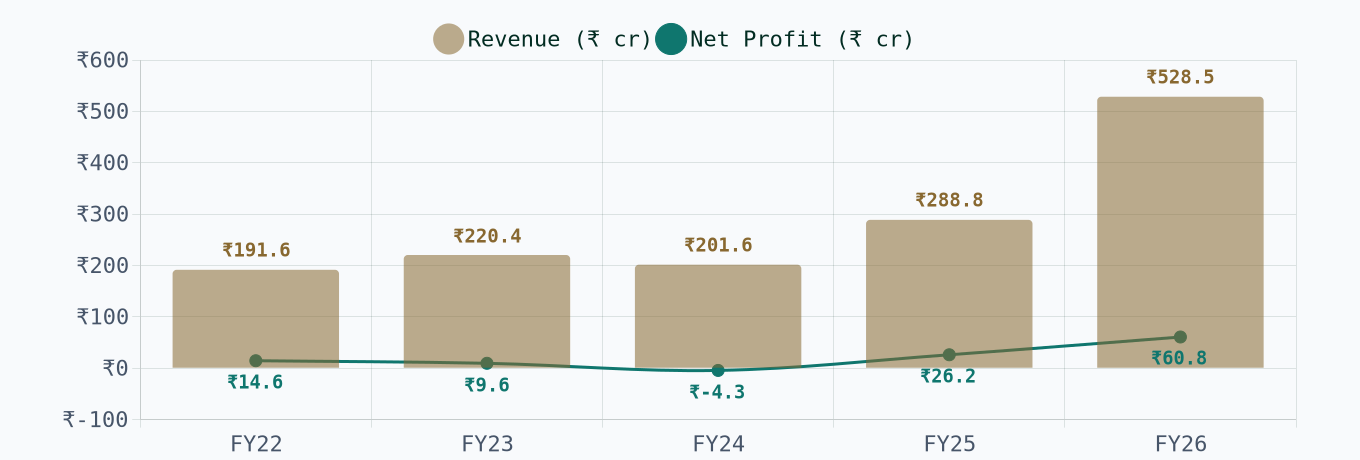
ASM reports one consolidated set of books across its Design-Led Manufacturing (DLM) and Engineering R&D (ER&D) segments, plus subsidiaries such as ASM Digital Technologies (US/Singapore) and the newly-registered Vietnam unit. Figures below are drawn from ASM's Q4 & FY26 investor presentation (dated 10 May 2026) and a Screener.in data export.
ASM reports one consolidated set of books across its Design-Led Manufacturing (DLM) and Engineering R&D (ER&D) segments, plus subsidiaries such as ASM Digital Technologies (US/Singapore) and the newly-registered Vietnam unit. Figures below are drawn from a Screener.in consolidated data export, cross-checked against ASM's own Q4 & FY26 investor presentation (10 May 2026). EBITDA is Screener's "Operating Profit" line (Sales less operating expenses, before other income, depreciation and interest) — treated as equal to EBITDA.
Revenue vs Net Profit — 5 Year Trend
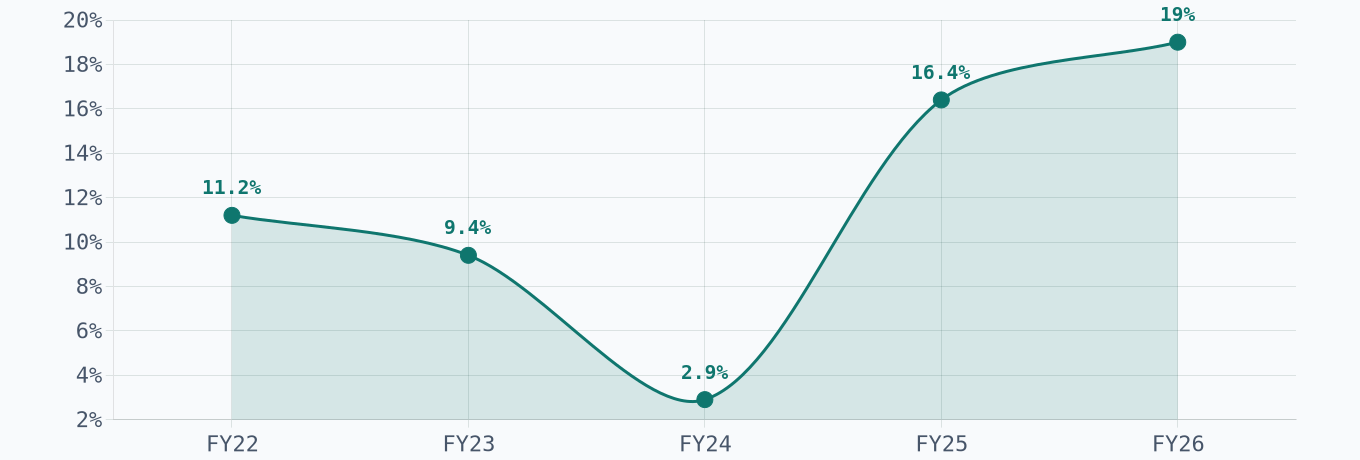
EBITDA Margin — 5 Year Trend
+83%
Revenue growth, FY26 YoY
21.9%
ROCE, FY26 (company-disclosed)
₹760 cr
Combined Karnataka + Tamil Nadu capex MoUs
108x
Trailing P/E — rich vs. IT-services peer avg. (~20x)
Last 8 Quarters
₹ crore | Q1 FY25 | Q2 FY25 | Q3 FY25 | Q4 FY25 | Q1 FY26 | Q2 FY26 | Q3 FY26 | Q4 FY26 |
|---|---|---|---|---|---|---|---|---|
Sales | 52.6 | 56.9 | 64.7 | 114.5 | 122.9 | 154.5 | 116.0 | 135.1 |
Sales YoY | n.a. | n.a. | +16.2%◊ | +156.8%◊ | +133.6% | +171.3% | +79.2% | +18.0% |
EBITDA | 3.9 | 6.3 | 11.9 | 25.4 | 25.7 | 30.4 | 19.5 | 25.0 |
EBITDA YoY | n.a. | n.a. | +3,297%◊ | +2,169%◊ | +567% | +382% | +64% | (2%) |
EBITDA Margin | 7.3% | 11.1% | 18.4% | 22.2% | 20.9% | 19.7% | 16.8% | 18.5% |
PBT | 1.4 | 3.6 | 7.7 | 21.6 | 21.4 | 26.4 | 13.1 | 23.3 |
PAT | 3.1 | 2.9 | 5.2 | 15.4 | 15.6 | 19.1 | 9.3 | 16.8 |
PAT YoY | n.a. | n.a. | n.m.◊ | n.m.◊ | +406% | +569% | +79% | +9% |
PAT Margin | 5.9% | 5.0% | 8.0% | 13.4% | 12.7% | 12.4% | 8.0% | 12.4% |
Source: Screener.in consolidated quarterly export; EBITDA = Operating Profit as reported there. Q1/Q2 FY25 show n.a. because the underlying export's earliest available quarter is Q3 FY24. ◊Q3/Q4 FY25 YoY figures are measured off a near-breakeven Q3/Q4 FY24 base (EBITDA of ₹0.35 cr and ₹1.12 cr respectively, PAT slightly negative in both) — the resulting triple/quadruple-digit percentages are a mechanical base effect, not a like-for-like growth signal; the FY26-over-FY25 columns to their right are the more meaningful comparisons. Revenue growth has otherwise been sequentially volatile (+76.9%, then −24.9%, then +16.5% across three recent quarters) as the DLM/ER&D mix shifts quarter to quarter, and Q3–Q4 FY26 both show margin compression versus the preceding quarter as employee costs scaled ahead of revenue recognition.
Balance Sheet & Return Ratios — 3 Year (FY24–FY26)
Particulars | FY24 | FY25 | FY26 | FY24–26 CAGR |
|---|---|---|---|---|
P&L | ||||
Sales | 201.6 | 288.8 | 528.5 | +61.9% |
Sales YoY | n.a. | +43.2% | +83.0% | |
EBITDA◊ | 5.8 | 47.3 | 100.5 | +316%‡ |
EBITDA YoY | n.a. | +716%‡ | +112% | |
EBITDA Margin◊ | 2.9% | 16.4% | 19.0% | +16.1pp |
PBT | (10.6) | 34.6 | 84.1 | n.m. |
PAT¶ | (4.3) | 26.2 | 60.8 | n.m.¶ |
PAT YoY | n.a. | n.m. | +131.6% | |
PAT Margin | (2.1%) | 9.1% | 11.5% | +13.6pp |
Balance Sheet | ||||
Net Worth | 136.0 | 165.1 | 307.0 | +50.2% |
Net Debt‡ | (18.2) | 44.0 | 10.2 | n.m. |
Net Block | 32.3 | 47.4 | 93.0 | +69.7% |
Net Working Capital | 69.6 | 86.1 | 157.3 | +50.4% |
Avg. NWC Days | 114 | 98 | 84 | (30d) |
Returns & Cash Conversion | ||||
ROCE | (0.2%) | 18.4% | 21.9% | +22.1pp |
ROE | (7.0%) | 17.0% | 25.7% | +32.7pp |
CFO / EBITDA◊ | n.m.§ | (49.7%) | 67.6% | n.m.§ |
FCF / EBITDA◊ | n.m.§ | (102.5%) | 8.3%§ | n.m.§ |
Net Worth, Net Debt, ROCE and ROE are taken directly from / reconciled to ASM's own investor presentation, which defines Capital Employed as end-of-year Net Worth + Total Debt (including lease liabilities) and computes ROE on average Net Worth — replicating that convention here ties out exactly to the company's disclosed 18.4% / 21.9% (ROCE) and 17.0% / 25.7% (ROE) for FY25/FY26; these are unaffected by the EBITDA restatement below since they use EBIT/PAT directly, not EBITDA. Net Debt = Total Debt (borrowings + lease liabilities, non-current and current) − Cash & Bank Balances − Investments. Net Block = Property, Plant & Equipment. Net Working Capital = Trade Receivables + Inventories − Trade Payables; Avg. NWC Days = Average(opening, closing NWC) ÷ Revenue × 365. CAGR column is a 2-year (FY24→FY26) compound annual growth rate for absolute rows; margin/ratio rows show the percentage-point (pp) change over the same period instead, since a CAGR of a margin isn't a meaningful number. ◊EBITDA throughout = Screener's "Operating Profit" (Sales − operating expenses, before other income/depreciation/interest); this is materially the same figure ASM's own presentation cites for FY25/FY26, but is ~3% lower for FY24 (₹5.8 cr here vs. ₹6.0 cr sometimes cited) due to minor expense-classification differences. ‡EBITDA's +316% CAGR and Q3/Q4 FY25's triple-digit EBITDA YoY (quarterly table above) are mechanical base effects of FY24's near-breakeven starting point (EBITDA margin 2.9%) rather than a stable growth rate — read the FY25→FY26 EBITDA YoY (+112%) as the more representative recent trend. Net Debt convention as above. ¶PAT is Screener's directly-reported "Net Profit" line; it doesn't tie exactly to PBT less Tax shown above (FY24: −10.6 − (−3.5) would imply −7.1 versus the −4.3 reported), which likely reflects a minority-interest or discontinued-operations adjustment not separately broken out in this export — FY24 CAGR/YoY built off this PAT line are therefore marked not meaningful. §FY24 EBITDA (₹5.8 cr) is near break-even, making CFO/EBITDA and FCF/EBITDA not meaningful that year; FCF is estimated as CFO less net capex (approximated from the change in Net Block plus depreciation), since gross capex isn't separately disclosed in the cited presentation.
Valuation Snapshot
₹6,565 cr
Market Cap
₹4,500.55
Price (latest)
108.1x
P/E (FY26 EPS)
65.4x
EV/EBITDA (FY26)
EV = Market Cap + Net Debt = ₹6,565 cr + ₹10 cr = ₹6,575 cr. EV/EBITDA uses the Excel-sourced FY26 EBITDA of ₹100.5 cr. Both multiples are rich against the broader IT-services/engineering-consulting peer set (P/E generally high-teens to low-20s) and already price in a successful, large-scale manufacturing ramp — the stock has also moved a great deal in the period these figures are drawn from (see price chart below), so treat as a point-in-time snapshot rather than a stable multiple.
Share Price — Last 1 Year
ASM Technologies — Daily Closing Price (₹)
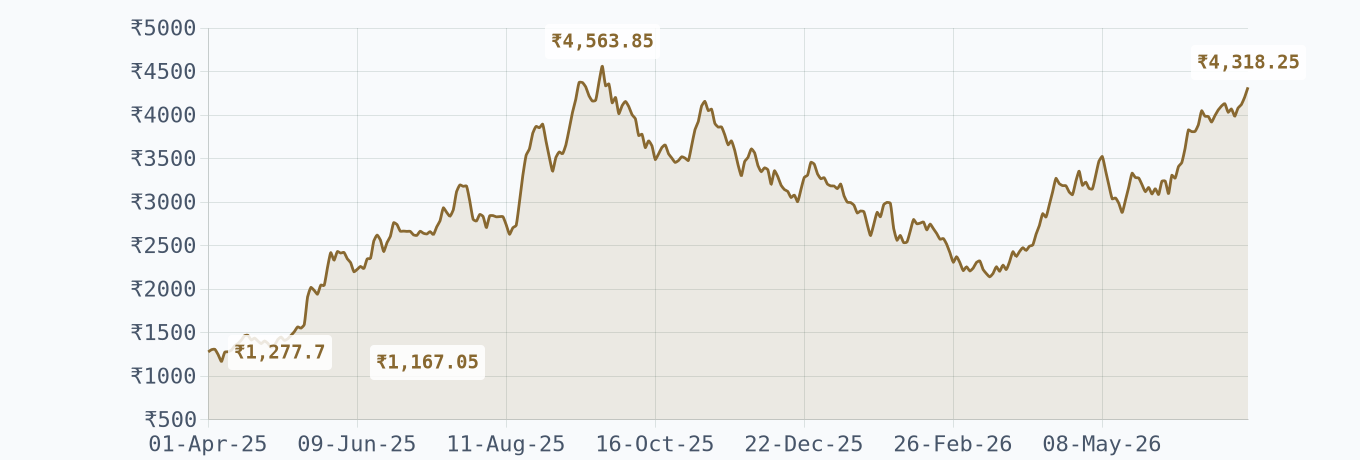
Daily NSE closing prices, 1 Apr 2025–13 Jul 2026 (315 trading days), plotted day-by-day rather than at month-ends; labelled points mark the period's open, peak, trough and latest close. Period high ₹4,563.85 (23 Sep 2025); period low ₹1,167.05 (7 Apr 2025). Company-disclosed trailing 52-week high/low (to 13 Jul 2026): ₹4,595.55 / ₹2,099.90 — the stock has been volatile enough that the 52-week window and the chart's own peak/trough don't fall on the same dates.
Note on Quarterly Volatility & Funding
Quarterly revenue has swung sharply through the transition (+76.9% then −24.9% then +16.5% sequentially across recent quarters), and Q4 FY26 showed margin compression (operating margin ex-other-income down ~350 bps YoY to 18.7%) as employee costs rose faster than revenue — a pattern to watch as the company scales manufacturing headcount ahead of revenue recognition. In June 2026 the board approved a fundraise of up to ₹500 crore via equity/debt to fund the capacity build-out, and the company has secured in-principle approval for an NSE listing.
Cross-Company Comparison
Same Playbook, Different Stage of Execution
FY26 Revenue Growth vs. EBITDA / Operating Margin
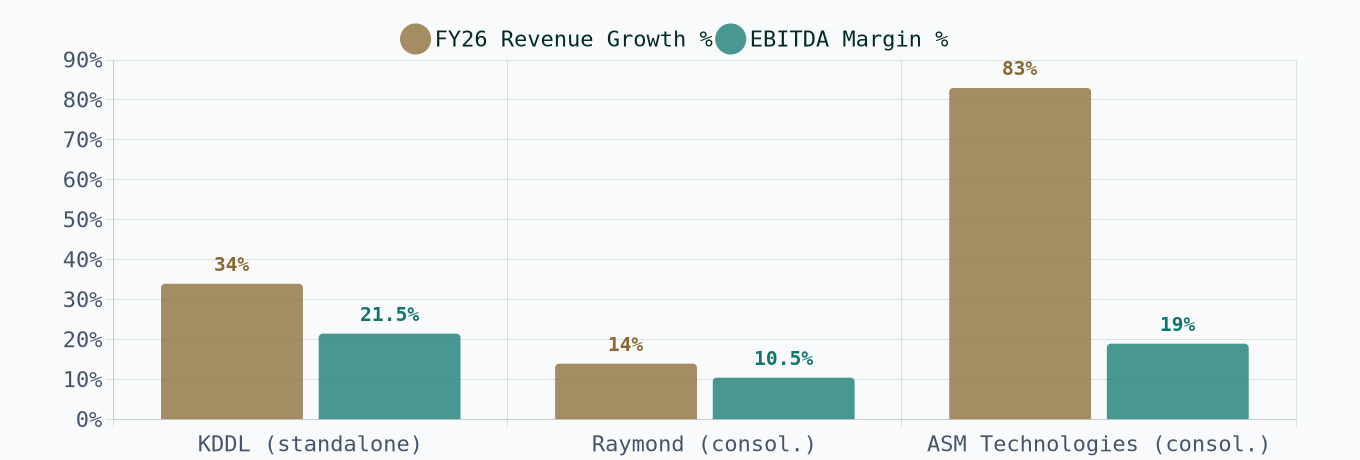
Note the basis differs by company: KDDL figures here are standalone (parent entity only, excluding Ethos and other subsidiaries), while Raymond and ASM Technologies are shown on a consolidated basis. This is the most representative view of each company's own manufacturing engine, but it means the bars aren't a strict apples-to-apples comparison of group-wide scale.
What's Common
All three are converting a non-manufacturing legacy identity (retail holding co., textile conglomerate, IT services) into an export- or localisation-linked precision manufacturing engine.
Each is riding a distinct structural tailwind: China+1 sourcing (KDDL, Raymond), aerospace/defence localisation (Raymond), and India's ESDM/semiconductor push (ASM Technologies).
Each is capex-heavy right now — KDDL and Raymond are funding expansion from operating cash flow while staying near debt-free; ASM Technologies is raising external capital.
What Differs
KDDL's manufacturing engine (Eigen) is still a minority of consolidated revenue, with the Ethos retail subsidiary dominating headline numbers.
Raymond has already completed its structural separation — the entity you buy today is the manufacturing business, but reported margins are depressed by post-demerger transition costs.
ASM Technologies is earliest-stage and highest-growth, but also carries the richest valuation and the least manufacturing track record of the three.
Key Risks to the Thesis
Execution Each company's growth case rests on capex now translating into qualified, revenue-generating capacity later (Raymond's Gudipalli plant by H2 FY28; ASM's Karnataka facility on an 18–24 month land-acquisition timeline). Delays compress the runway the market is already pricing in.
Concentration Aerospace and precision-engineering revenue is concentrated among a handful of global OEM relationships (Safran, Airbus supply chain for Raymond; a small number of semiconductor-equipment majors for ASM) — customer loss or program delay risk is real.
Margin Ramp-up phases are visibly compressing margins in the near term — Raymond's consolidated EBITDA margin fell YoY in FY26, and ASM's operating margin contracted sequentially in Q4 FY26 as employee costs outpaced revenue.
Valuation ASM Technologies trades at roughly 108x trailing earnings against an IT-services peer average nearer 20x — a valuation that already assumes the manufacturing transition succeeds at scale, and has re-rated further even since this note's KDDL/Raymond figures were compiled.
Legacy drag KDDL's watch-components business and Raymond's residual standalone entity both face demand headwinds (Swiss luxury softness; post-demerger standalone losses respectively) that can offset gains in the manufacturing engine.
Native Invest · Research Note Prepared by Native Investment Managers LLP (SEBI-registered Investment Adviser, INA000022163). This note compiles information from company investor presentations and Screener.in-format financial exports supplied directly — KDDL's and ASM Technologies' Q4 & FY26 investor presentations (19 May 2026 and 10 May 2026 respectively) and standalone/consolidated data workbooks, Raymond's investor presentation and consolidated data workbook, and daily NSE closing-price histories (Apr 2025–13 Jul 2026) for all three companies — for informational purposes only. KDDL figures are presented on a standalone basis throughout (see note in that section); ASM Technologies and Raymond are consolidated. Raymond's quarterly and balance-sheet figures are affected by the Lifestyle (Sep 2024) and Realty (May 2025) demergers in ways this note flags but can't fully reconcile from the data available — treat those specific figures with extra caution, and prefer the company-disclosed segment figures where the two diverge. This is not investment advice, a research report under SEBI (Research Analysts) Regulations, or a recommendation to buy, sell, or hold any security. Figures reflect results and prices as of the data supplied (through 31 July 2026) and may since have moved. Past performance and management guidance are not indicative of future results. Readers should conduct independent due diligence or consult a qualified adviser before making investment decisions.