Insights
Weekly Market Map - 8 August, 2026
Weekly Market Map

In this article
- Nifty adds 0.8% WoW as Midcaps and Smallcaps hit fresh highs; RBI holds repo at 5.25%
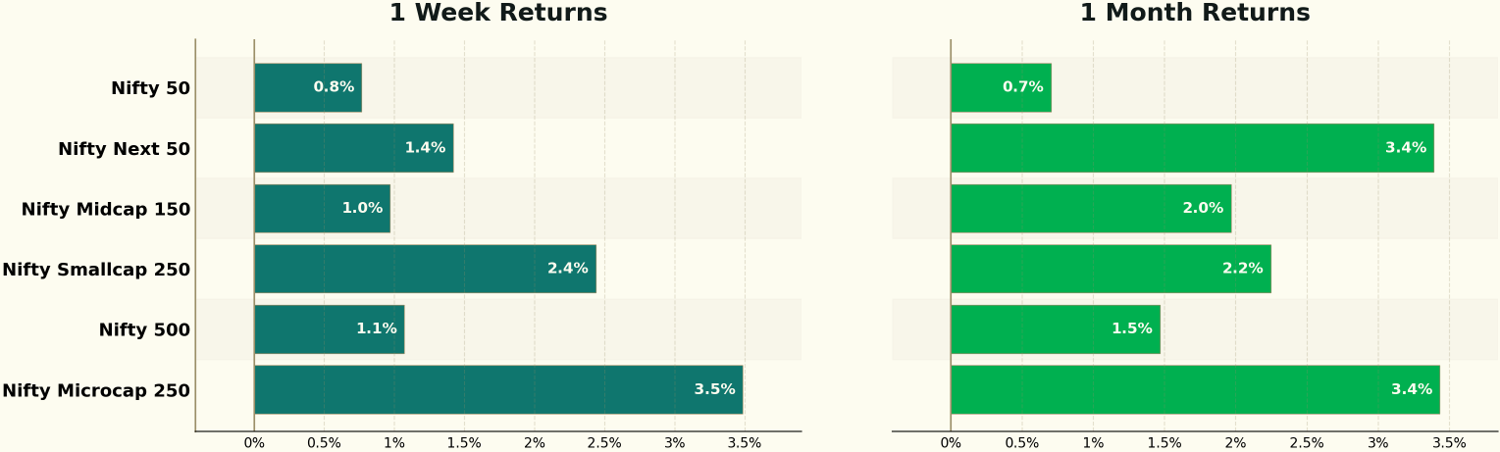
- Microcaps lead with 3.5% WoW; Quality tops the factor table with 4.4% over one month
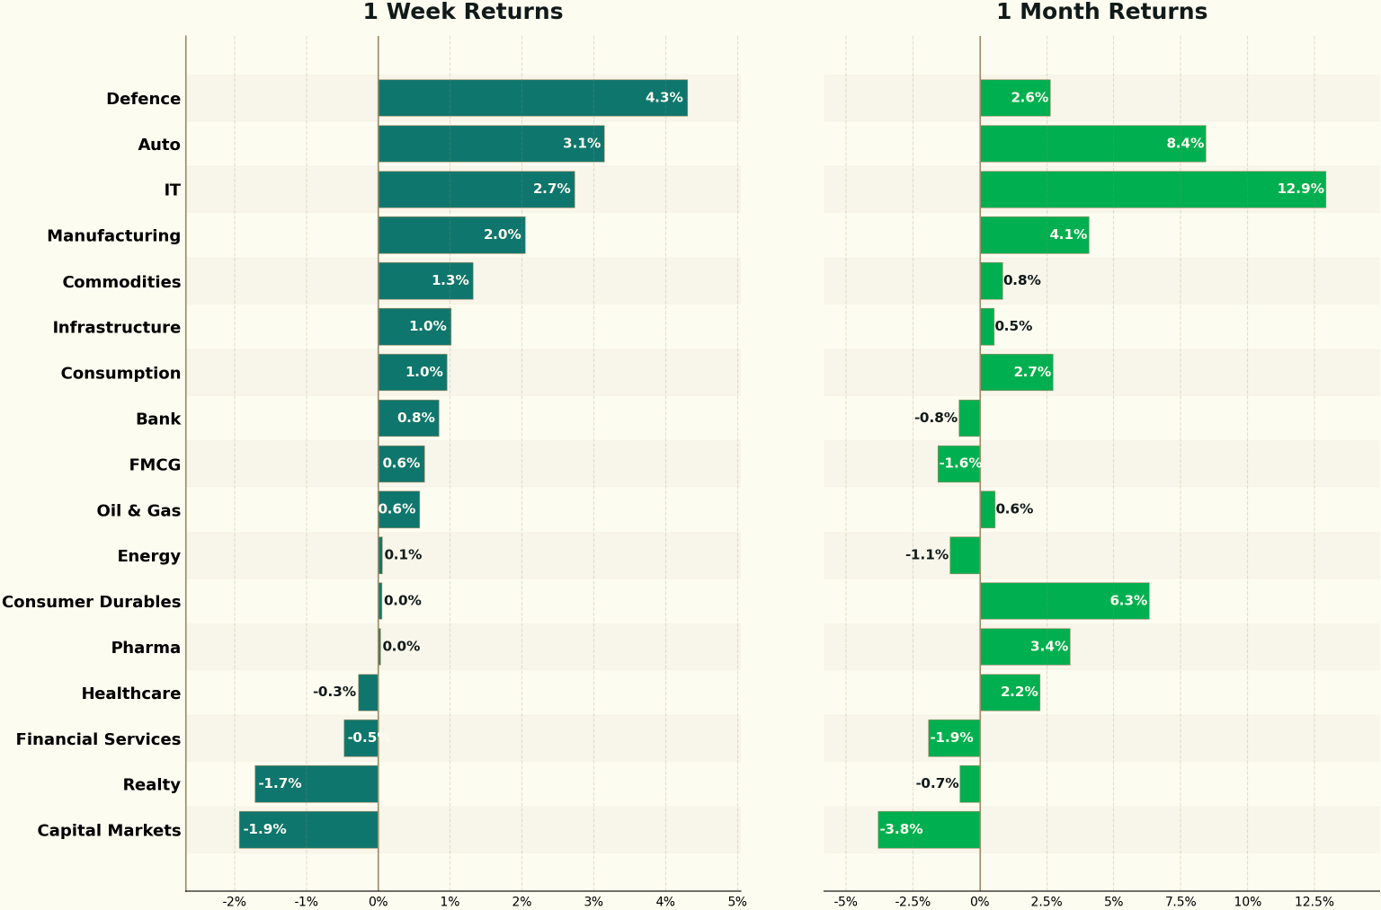
- Defence, Auto and IT lead this week's sector rally; IT extends 1-month gain to 12.9%
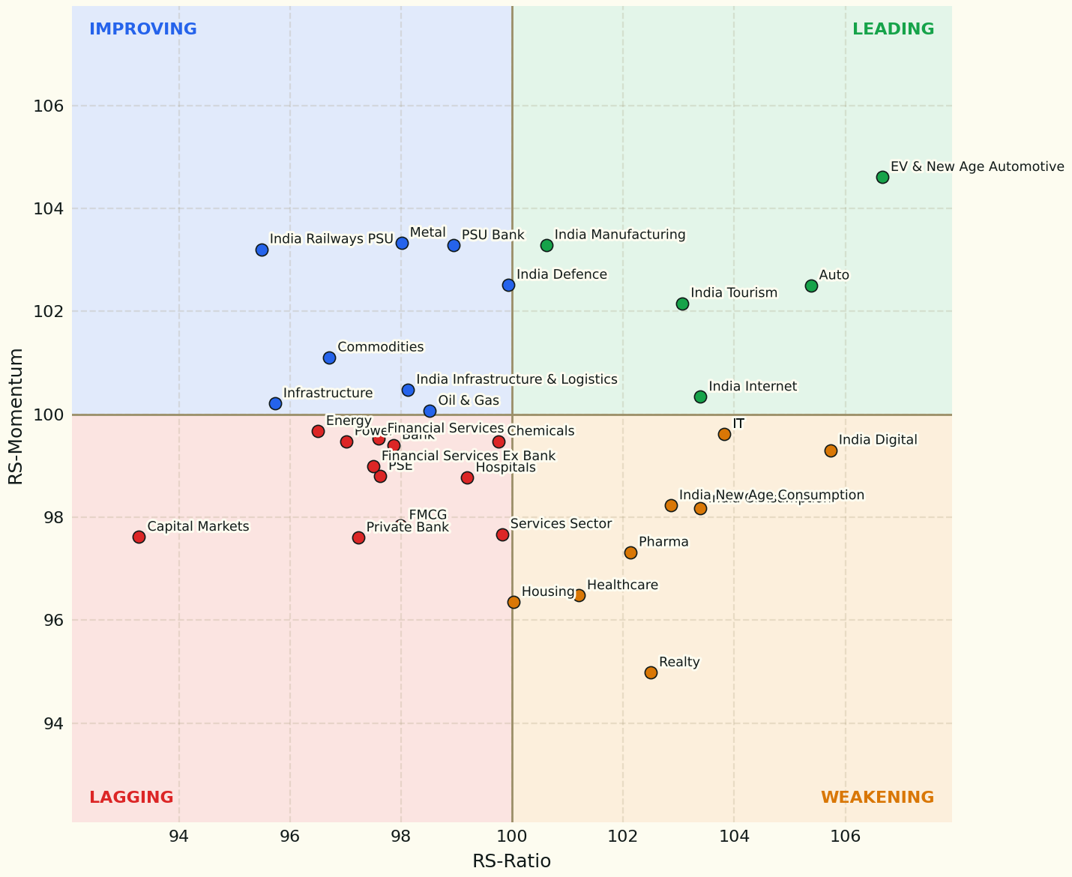
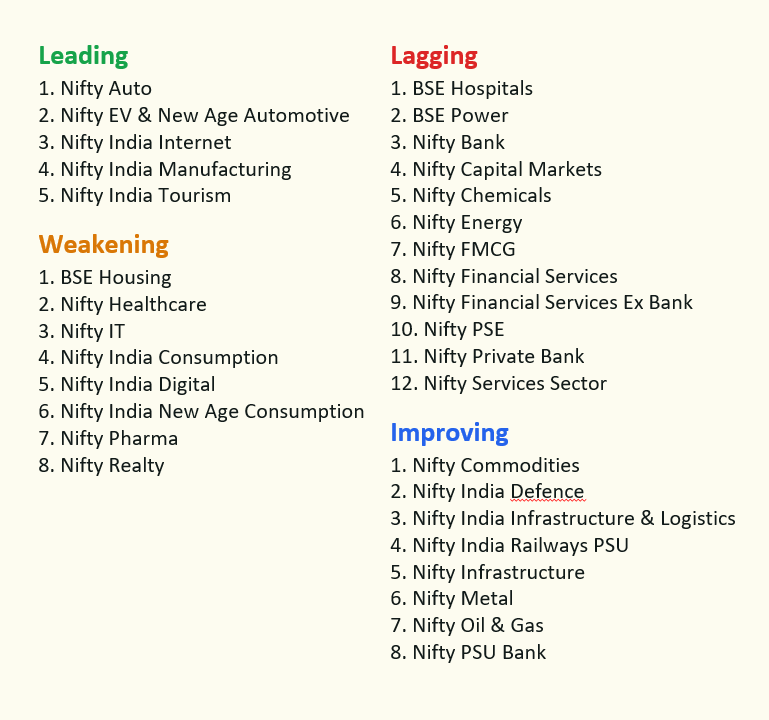
- Sector Rotation: Auto, EV and Manufacturing lead; IT, Pharma and Healthcare weaken
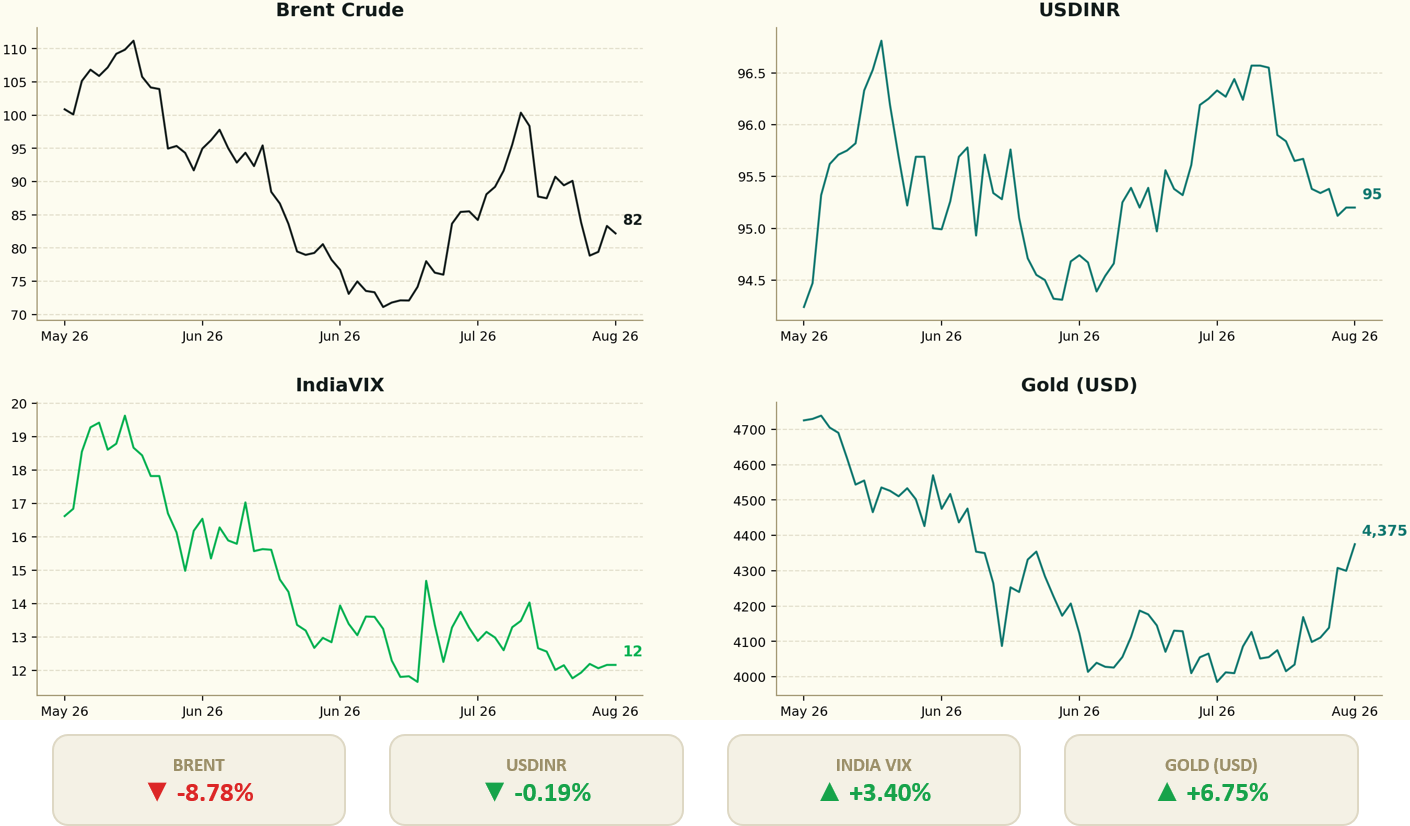
- Macro: Brent slides 8.8%, Gold jumps 6.8%, India VIX edges up 3.4% as rupee holds
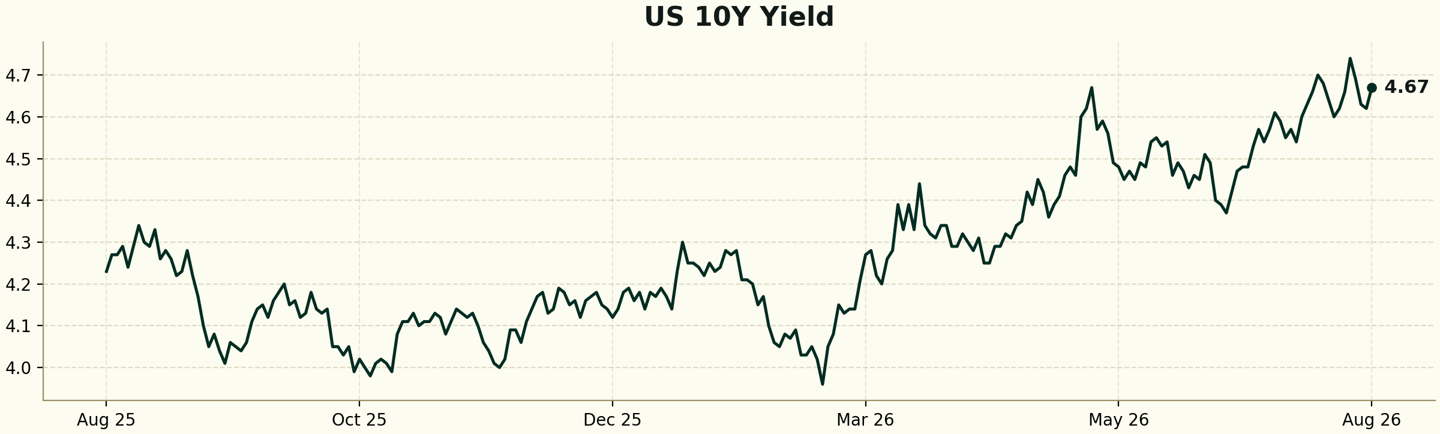
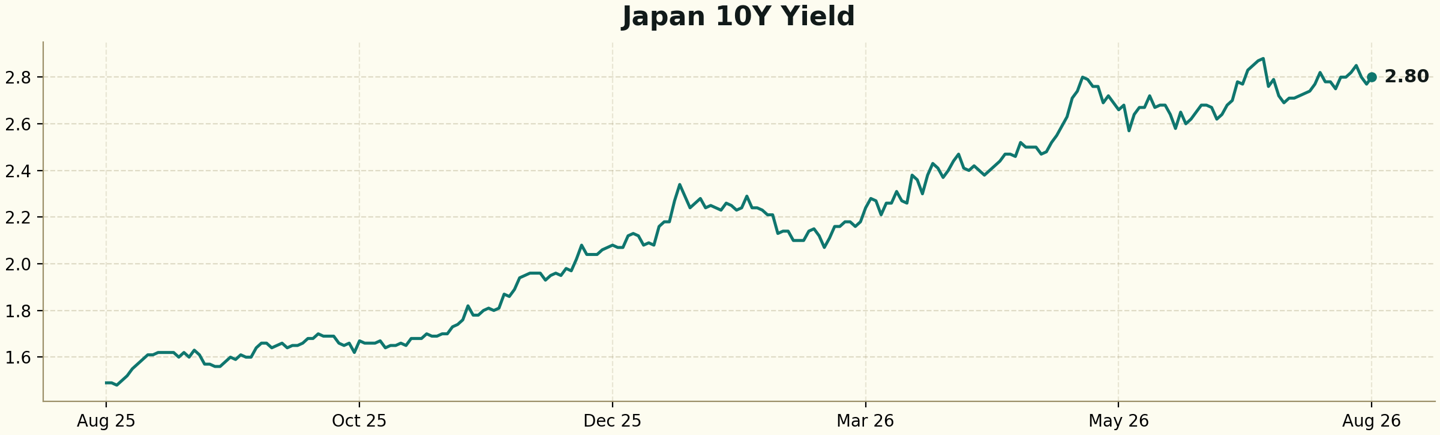
- US 10-year firms to 4.67%; Japan 10-year stays elevated around 2.80%
- Q1FY27 Results: Margin expansion, not volume, drove the quarter — mid-caps and Chemicals lead
- Revenue leaders are not profit leaders — Banks convert best, Construction and Leisure lag
- Stocks Showing Positive Quant Signals
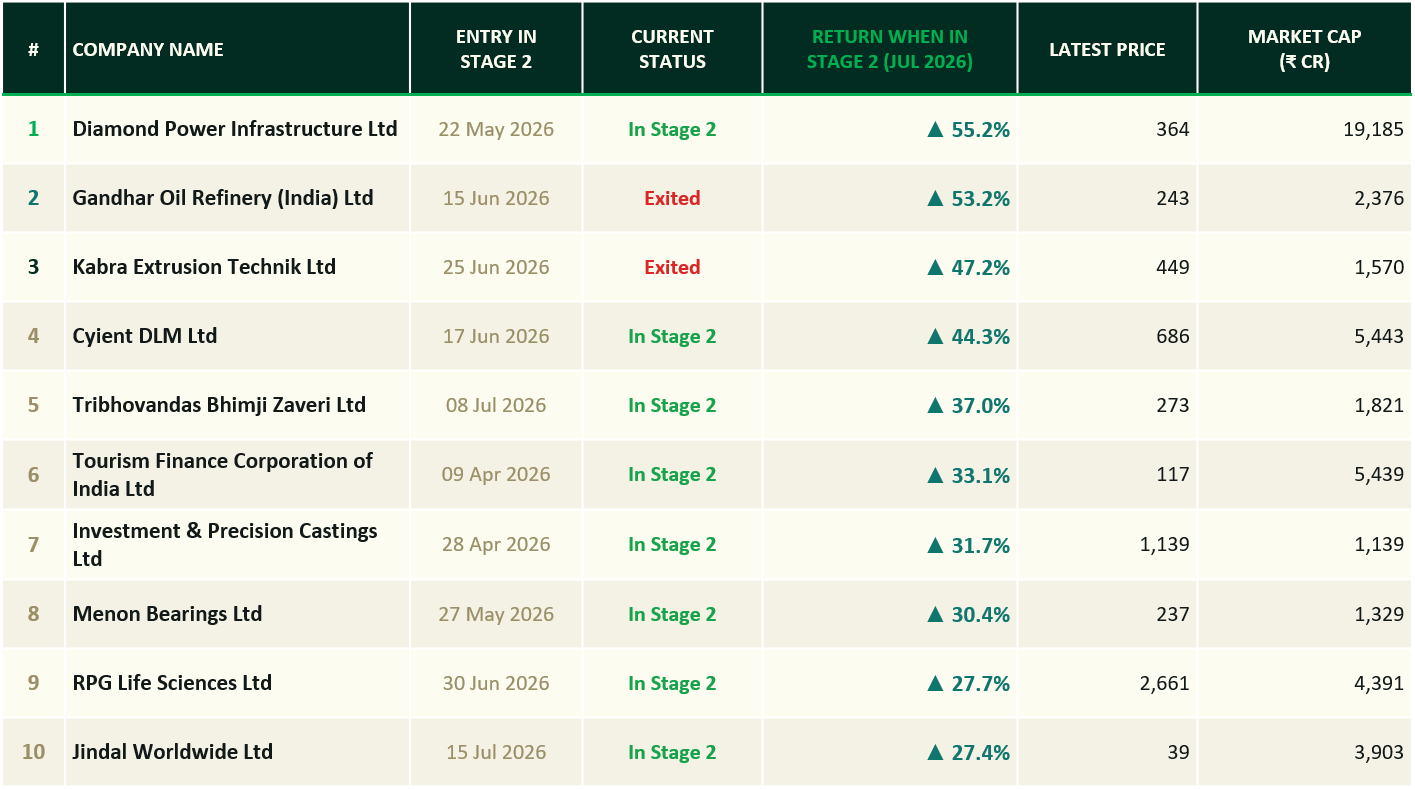
- Top 10 Price Performers — July 2026
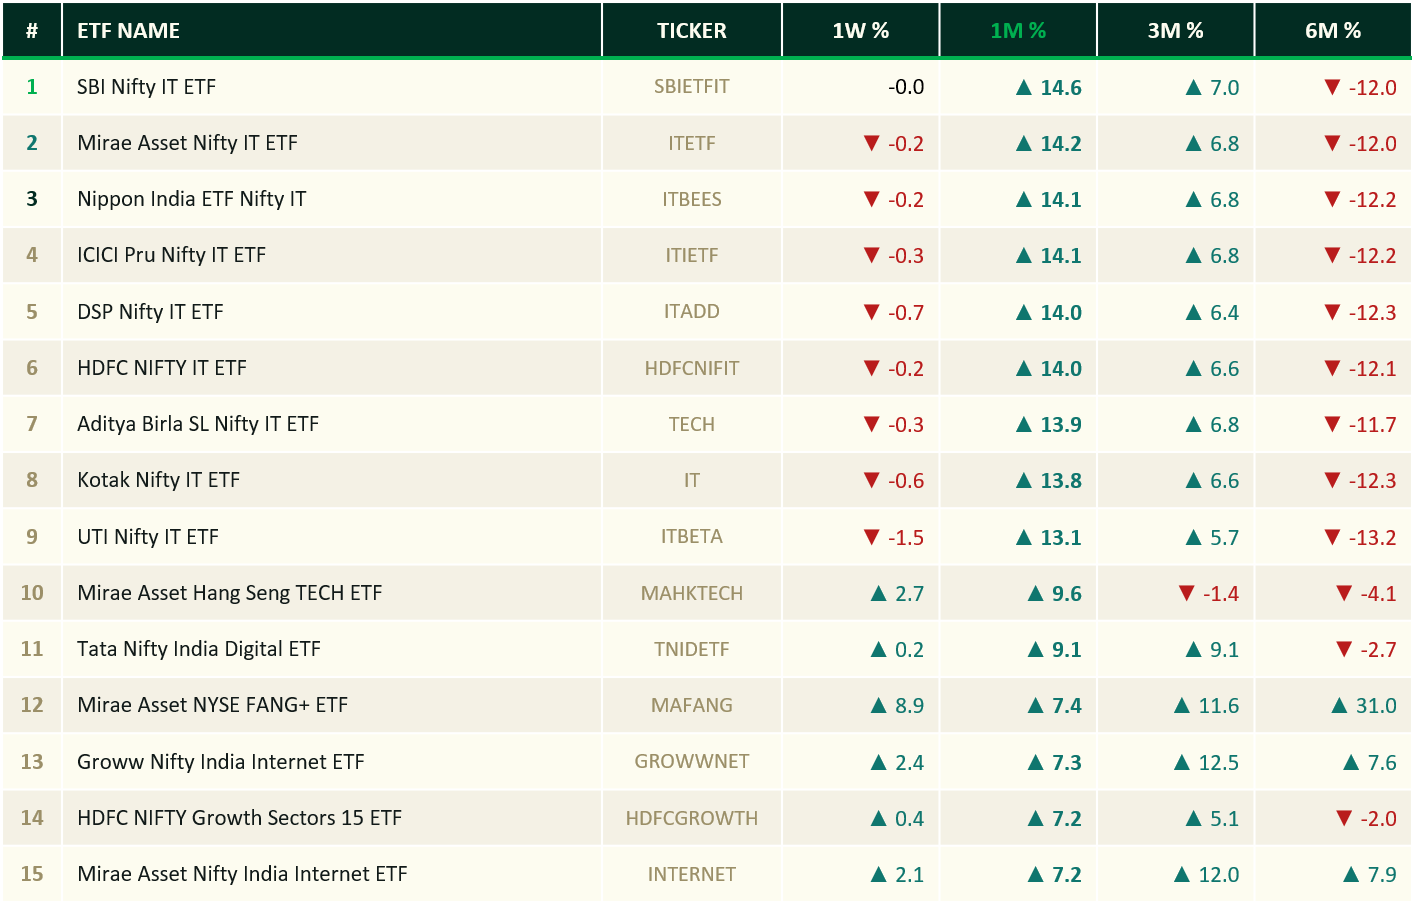
- Top 15 Performing ETFs
Nifty adds 0.8% WoW as Midcaps and Smallcaps hit fresh highs; RBI holds repo at 5.25%
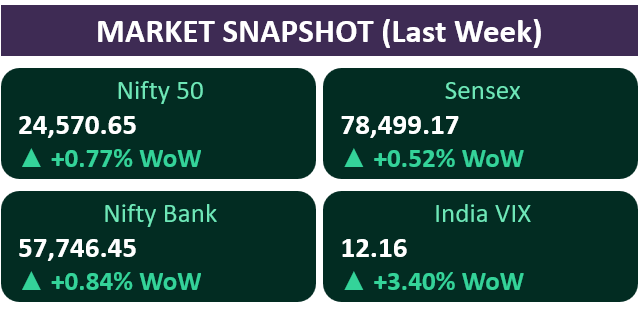
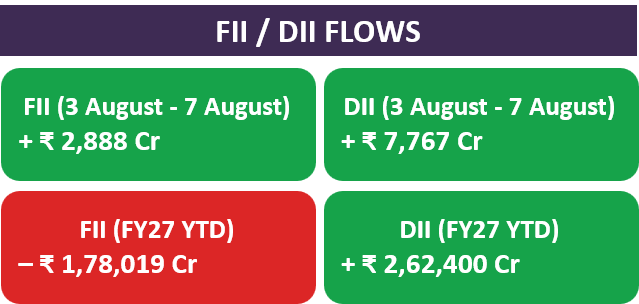
Week’s Recap
New CAS timings from Aug 3 — F&O stocks stop continuous trading at 3:15 PM, auction till 3:35 PM (replaces VWAP). Nifty's official close jumped from 24,573 to 24,774 (+1.60%) post-cutoff on debut day, sparking D-Street confusion until NSE clarified no fresh trades occurred
RBI MPC (Aug 5) — repo held at 5.25%, neutral stance, 4th straight pause. Malhotra: "neither dovish nor hawkish."
Nifty Midcap & Smallcap trading near ATH — Smallcap 100 hit a fresh 52-week high of 19,878.25 (+0.48%) Friday; Midcap 100 closed just under its Aug 3 record of 63,510.60.
Crude eased on Iran talk hopes — Brent fell 8% to $82.84/bbl Monday, then softened further through the week, supporting risk sentiment.
Manipal Health IPO (₹9,275 Cr) — India's largest healthcare listing debuted Aug 5 at an 11% premium; market cap ~₹87,700 Cr.
Next Week Ahead
US NFP (July) — released Aug 7 post-close; consensus +83K vs June's soft +57K, key Fed rate-path input.
India CPI (July) — due ~Aug 12; June print ran hot at 4.38% YoY, above RBI's 4% midpoint.
Crude/Iran — Iran's parliament still weighing its Hormuz-transit draft proposal; key swing factor for rupee and FII flows.
Q1 FY27 earnings tail — tapering into smaller/SME names as large-caps wrap up reporting.
Nifty technicals — support 24,300–24,400/24,000; resistance 24,600, then 200-DMA near 24,780.
Microcaps lead with 3.5% WoW; Quality tops the factor table with 4.4% over one month
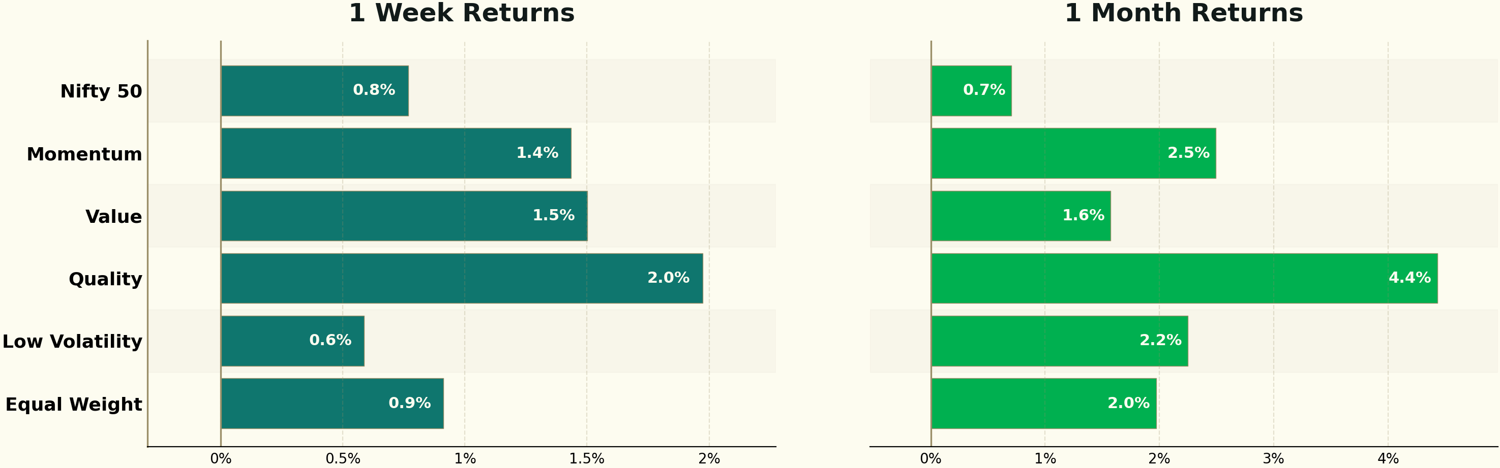
Defence, Auto and IT lead this week's sector rally; IT extends 1-month gain to 12.9%
Sector Rotation: Auto, EV and Manufacturing lead; IT, Pharma and Healthcare weaken
Macro: Brent slides 8.8%, Gold jumps 6.8%, India VIX edges up 3.4% as rupee holds
US 10-year firms to 4.67%; Japan 10-year stays elevated around 2.80%
Q1FY27 Results: Margin expansion, not volume, drove the quarter — mid-caps and Chemicals lead
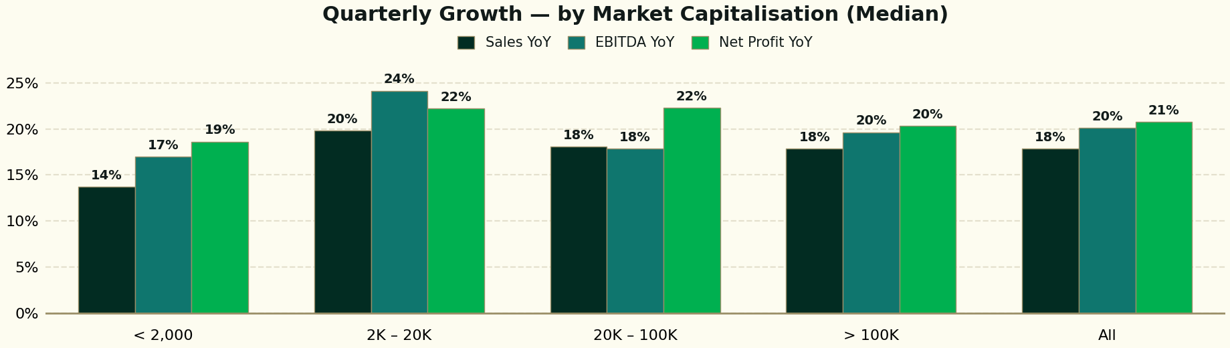
Profit growth outpaces revenue everywhere. Median sales +18% vs net profit +21% — the quarter is margin-led, not volume-led.
Mid-caps (₹2K–20K cr) show the best operating leverage, with EBITDA +24% and PAT +22%; small-caps (<₹2,000 cr) lag on all three lines (14/17/19).
Large-caps are steady but unexceptional (18/20/20) — growth is broad-based across the size curve rather than concentrated at the top.
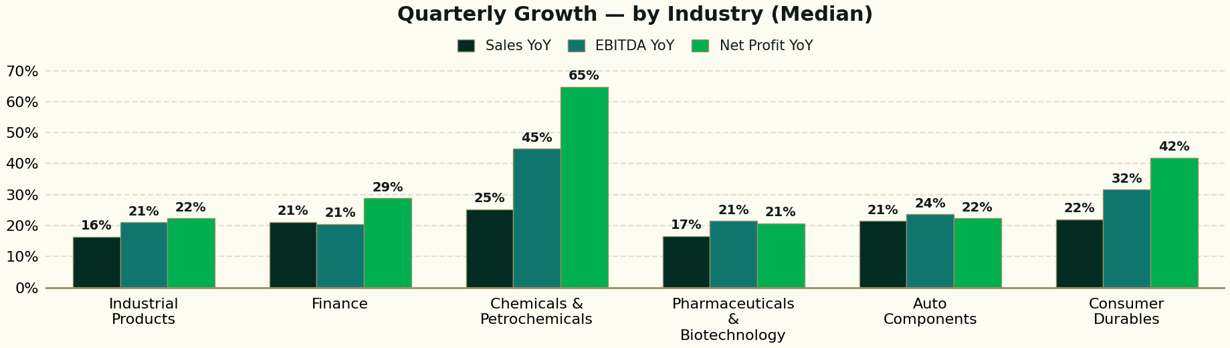
Chemicals & Petrochemicals is the clear outlier — 25% sales translating into +45% EBITDA and +65% PAT on a soft base and input-cost relief.
Consumer Durables echoes the same pattern (22/32/42), pointing to demand pickup plus operating leverage.
Finance converts well (PAT +29% on 21% sales); Pharma and Industrial Products are steady mid-teens to low-20s compounders.
Revenue leaders are not profit leaders — Banks convert best, Construction and Leisure lag
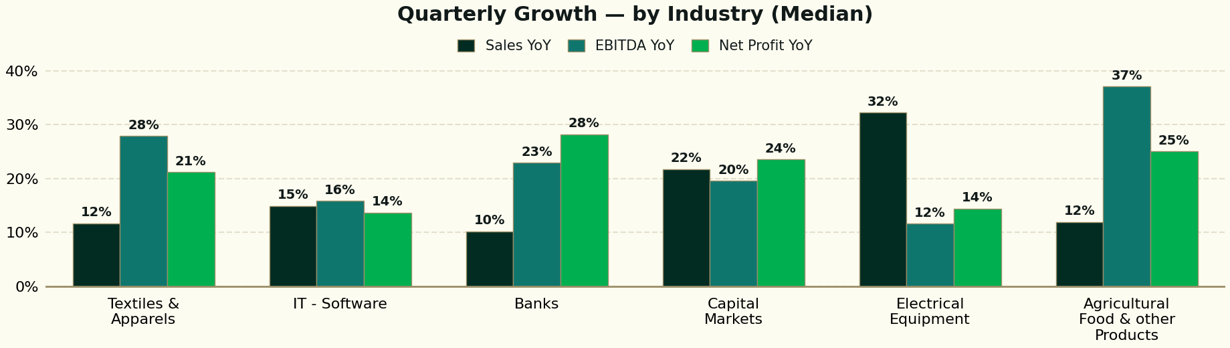
Electrical Equipment leads on revenue (+32%) but converts poorly (EBITDA +12%, PAT +14%) — order-book growth is coming at thinner margins.
Banks show the reverse profile: sales +10% but PAT +28%, driven by credit-cost normalisation rather than balance-sheet expansion.
Agri Food (+37% EBITDA) and Textiles (+28%) are margin-led on ~12% revenue; IT – Software is the laggard of the set at 15/16/14.
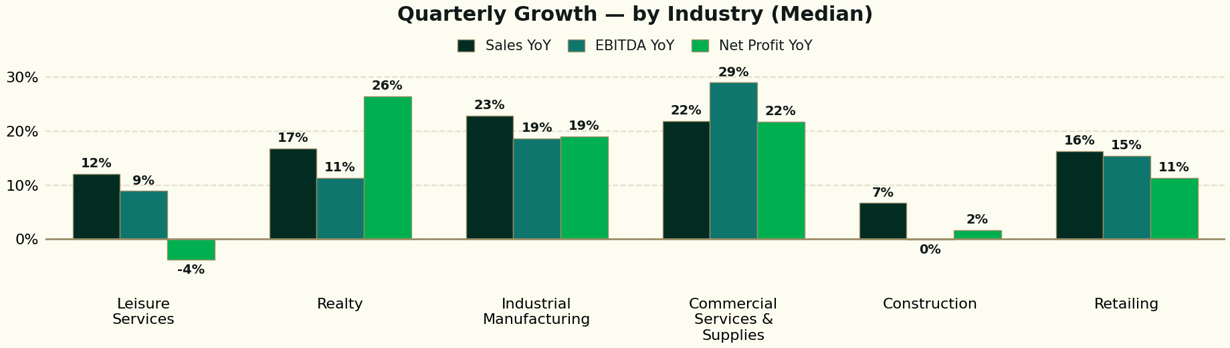
Commercial Services & Supplies and Industrial Manufacturing are the most balanced, with 19–29% growth across all three lines.
Realty converts strongly (PAT +26% on 17% sales); Construction is the weakest (7% sales, flat EBITDA, +2% PAT).
Leisure Services is the only negative print (PAT –4%) despite 12% revenue growth, indicating cost pressure at the operating level.
Stocks Showing Positive Quant Signals
Week of 3 August – 7 August • Native Quant Score
66 Total stocks flagged across all market caps this week.
Apr – Jul Stocks were +43.3% returns Annualized with Avg Holding period of 31 Days
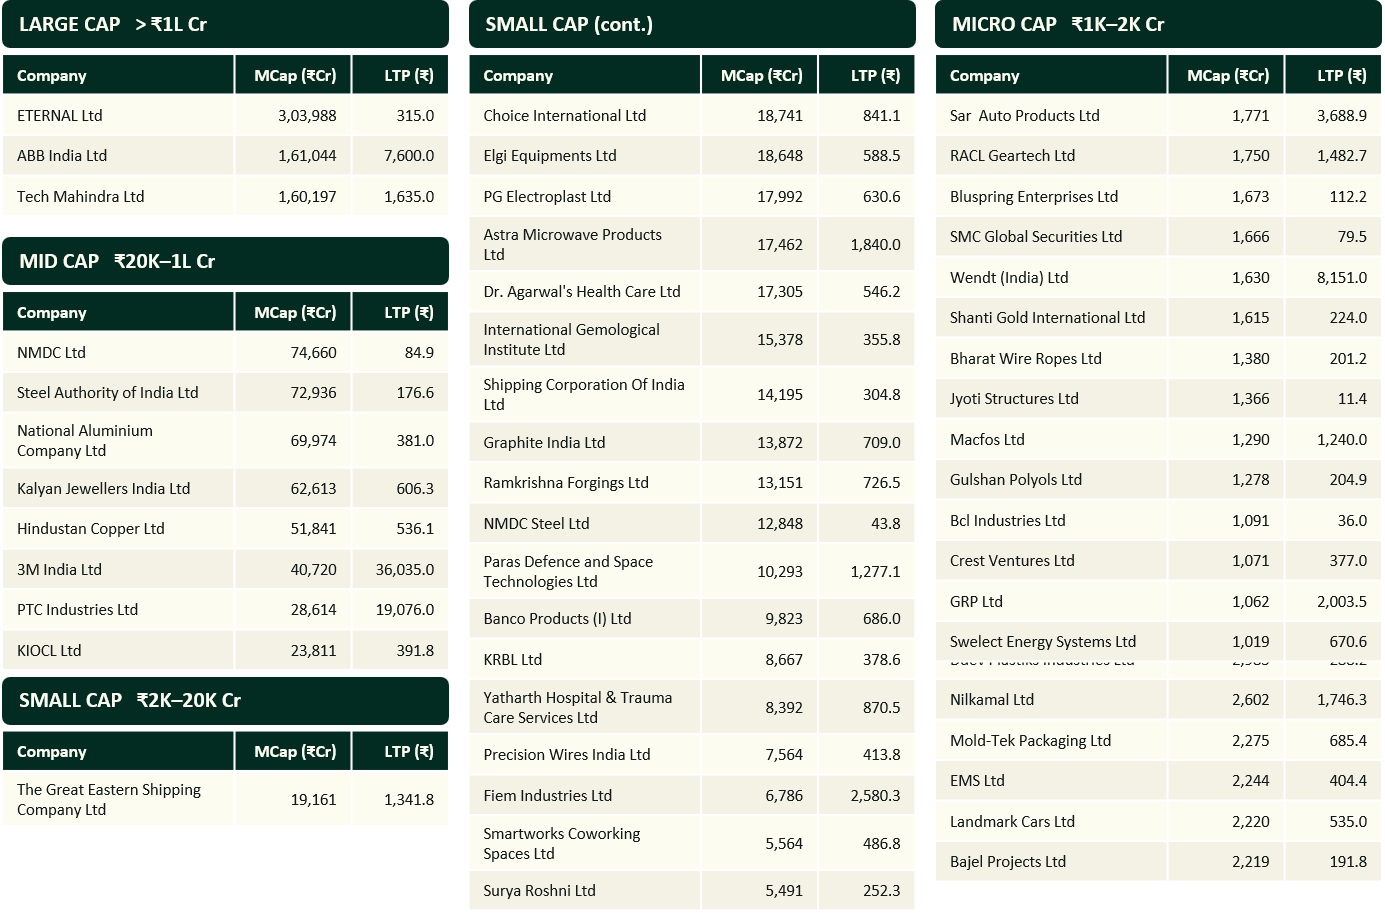
Top 10 Stage 2 Performers — July 2026
Returns: 01 Jul 2026 – 31 Jul 2026 • Status, CMP & market cap as on 07 Aug 2026
Top 15 Performing ETFs
As of 2026-08-06 • Ranked by 1 Month return